

 Dwi Wanna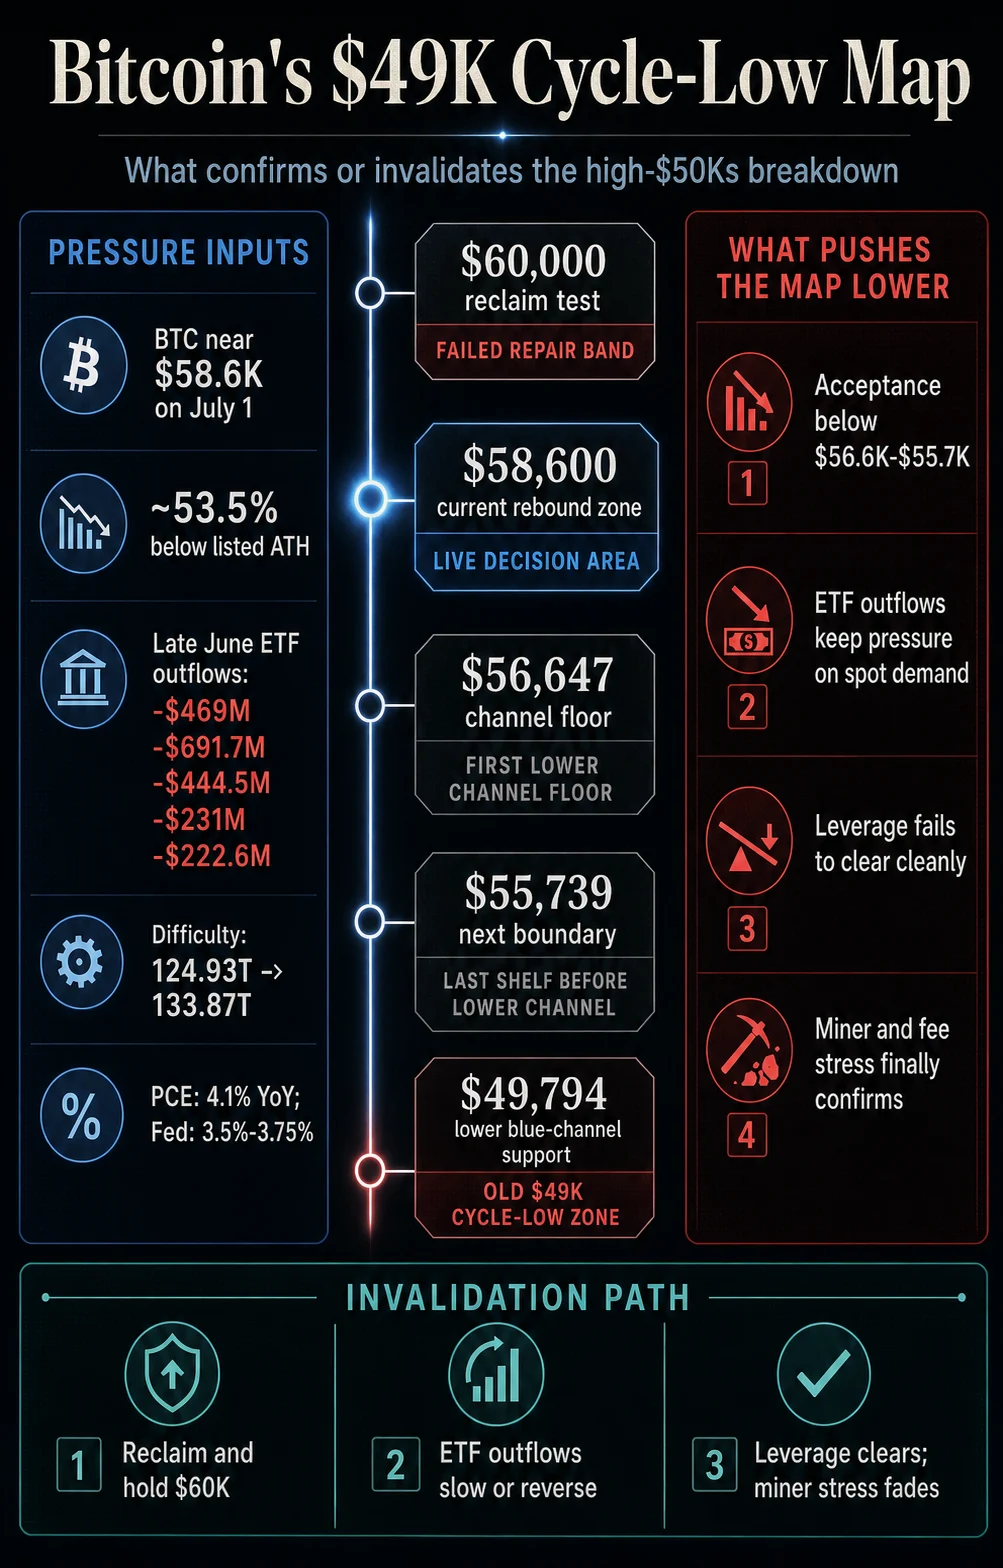
Bitcoin’s recent descent into the high-$50,000 range has fundamentally shifted the market narrative, bringing a previously theoretical $49,000 cycle-low map back into the center of active trading discussions. As of July 1, the primary cryptocurrency is trading at approximately $58,600, representing a significant 19% decline over the past 30 days. This downward trajectory places the asset roughly 53.5% below its all-time high of $126,198.07, according to the latest market data. The shift from a consolidation phase near $60,000 to a test of lower support levels suggests that the market’s underlying "plumbing"—comprising institutional flows, miner economics, and leverage—is under substantial stress.
Chronology of the Recent Market Correction
The current market volatility follows a period of relative stability observed in late June. Between June 26 and June 29, Bitcoin maintained a price floor of approximately $60,000. This psychological and technical level was viewed by many market participants as a "repair band," where the asset could potentially consolidate before a bullish reversal. However, this support proved fragile.
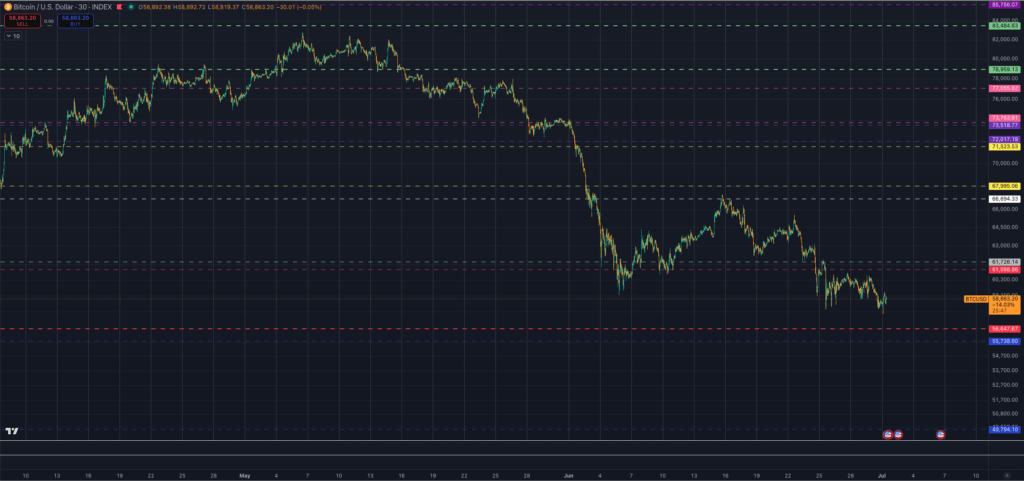
During early Asia trading hours on July 1, Bitcoin broke below the $60,000 threshold, reaching a local low of $57,735. Although a minor rebound toward the $58,200–$58,600 range occurred shortly thereafter, the breach of the $60,000 level has transitioned the $49,000 downside target from a background risk to an active decision-making framework. The current price action is now testing the lower boundaries of a multi-month channel, forcing analysts to evaluate whether current demand is sufficient to prevent a deeper retracement.
The Stress Stack: Drivers of the Bearish Thesis
The reactivation of the $49,000 cycle-low thesis is predicated on a "stress stack"—a combination of four critical market conditions that have deteriorated simultaneously. These factors include weakening demand for Spot Bitcoin Exchange-Traded Funds (ETFs), fragile leverage within the derivatives market, increasing pressure on miner economics, and limited spot absorption by retail and institutional buyers.

1. Institutional Outflows and ETF Elasticity
A primary driver of the recent price decline is the sustained outflow from US-based Spot Bitcoin ETFs. Data from late June indicates a troubling trend for institutional sentiment. On June 24, outflows reached $469 million, followed by a massive $691.7 million on June 25. The trend continued through the end of the month, with June 26 seeing $444.5 million in outflows, June 29 recording $231 million, and June 30 concluding with $222.6 million in net exits.
The iShares Bitcoin Trust (IBIT), managed by BlackRock, provides a stark example of this pressure. With net assets valued at approximately $43.23 billion, the fund’s Net Asset Value (NAV) recently touched $33.19, placing it at the bottom of its 52-week range. More notably, the year-to-date NAV return was down 31.08% as of late June. This data suggests that even the most robust institutional vehicles are facing significant holder pressure, transforming what was once a "buy-the-dip" engine into a potential sell-wall that bulls must overcome.
2. Leverage Fragility and Liquidation Cascades
The derivatives market has exacerbated the downward movement. The collapse of the $60,000 support level triggered a volatility shock, largely driven by long-liquidation events. On June 25, the market witnessed $427 million in long liquidations following the release of sticky inflation data.
Current positioning remains exposed, creating a condition of "conditional leverage fragility." If Bitcoin fails to maintain its current floor and slips toward the $56,000–$55,000 range, a self-reinforcing cycle of liquidations could accelerate the move toward the $49,000 target. Traders are increasingly loading up on downside hedges, indicating a lack of confidence in a near-term recovery.
3. Miner Economics and Network Difficulty
Miner capitulation remains a critical, albeit unresolved, component of the bearish thesis. Historically, cycle lows are often marked by miners being forced to sell their holdings to cover operational costs when "hashprice"—the expected value of hashing power—falls too low.
Recent data shows that Bitcoin network difficulty rose from 124.93 trillion on June 26 to 133.87 trillion on July 1, a 7.15% increase in just seven days. While a rising difficulty suggests network security is high, it also increases the cost of production for miners. If fee revenue remains soft and Bitcoin’s price continues to stagnate or drop, the pressure on miners could lead to a final "flush out" of supply, providing the confirmation needed for the $49,000 floor.
4. Macroeconomic Constraints
The broader economic environment provides little relief for risk assets. The Bureau of Economic Analysis recently reported that headline PCE inflation rose 4.1% year-over-year in May. Consequently, the Federal Reserve has maintained interest rates in the 3.5%–3.75% range, citing that inflation remains elevated relative to their 2% target. This restrictive monetary policy limits the "relief narrative" and reduces the likelihood of a liquidity-driven rally in the immediate future.
Key Technical Levels and Decision Zones
To navigate the current market, analysts have identified several "decision zones" that will determine whether the $49,000 path is confirmed or invalidated. These levels are based on session acceptance—where the price closes and stays—rather than temporary intraday "wicks."
| Level or Zone | Market Role | Confirmation Signals | Invalidation Signals |
|---|---|---|---|
| $58,600 to $60,000 | Failed Repair Band | Repeated rejection and closes pinned near $58,000. | A reclaim of $60,000 that holds across multiple sessions. |
| $56,647 | Current Channel Floor | Acceptance below this level accompanied by continued ETF outflows. | A fast recovery back into the high-$50,000s. |
| $55,739 | Final Boundary | Price treating the prior $56.6k floor as new resistance. | Strong spot demand absorbing the breakdown. |
| $49,794 | Blue-Channel Support | Sustained loss of the mid-$50,000s; deteriorating miner economics. | ETF flows stabilizing; leverage clearing cleanly. |
The Distinction Between Location and Proof
In technical analysis, a distinction must be made between "location" and "proof." Bitcoin’s current location—near $58,000—gives the $49,000 map relevance, as the asset is within striking distance of its lower channel boundaries. However, location is not proof of a further decline.
Proof would require "acceptance" below $56,647 and $55,739. Acceptance occurs when sellers are no longer being exhausted by buyers at a specific level, and the market begins to trade comfortably at lower prices. If the market cuts through these levels and fails to bounce, it confirms that the "plumbing" has broken, making the $49,794 support the next logical area for a cycle-low test.

Potential Invalidation and Bullish Scenarios
Despite the prevailing bearish sentiment, the $49,000 path is not a certainty. A clean invalidation of this thesis would require a significant shift in market behavior. Specifically, Bitcoin would need to reclaim the $60,000 level and hold it with demonstrable spot demand.
Signs of invalidation would include:
- Stabilization of ETF Flows: A shift from net outflows to steady, multi-day inflows would signal that institutional appetite has returned.
- Leverage Normalization: If the market can clear existing long positions without a fresh downside cascade, the pressure for a "forced" move lower would diminish.
- Miner Resilience: If miners manage to weather the current difficulty increase without significant selling of their reserves, the "capitulation" leg of the bear thesis would fail to materialize.
If these conditions are met, the high-$50,000 range may be viewed in retrospect as an "exhaustion low"—the point where sellers were finally depleted—rather than a mere shelf on the way to lower prices.
Broader Impact and Market Implications
The move toward $58,000 and the potential for a $49,000 test have broader implications for the digital asset ecosystem. First, it highlights the increasing sensitivity of Bitcoin to traditional financial metrics, particularly ETF flows and Federal Reserve policy. The "decoupling" narrative has largely been replaced by a reality where Bitcoin functions as a high-beta risk asset within institutional portfolios.
Second, the current price action serves as a stress test for the post-halving mining landscape. With rewards reduced and difficulty rising, only the most efficient operations will survive a sustained period of prices below $60,000. A move to $49,000 would likely accelerate consolidation within the mining industry, favoring publicly traded companies with deep capital reserves over smaller, independent operators.
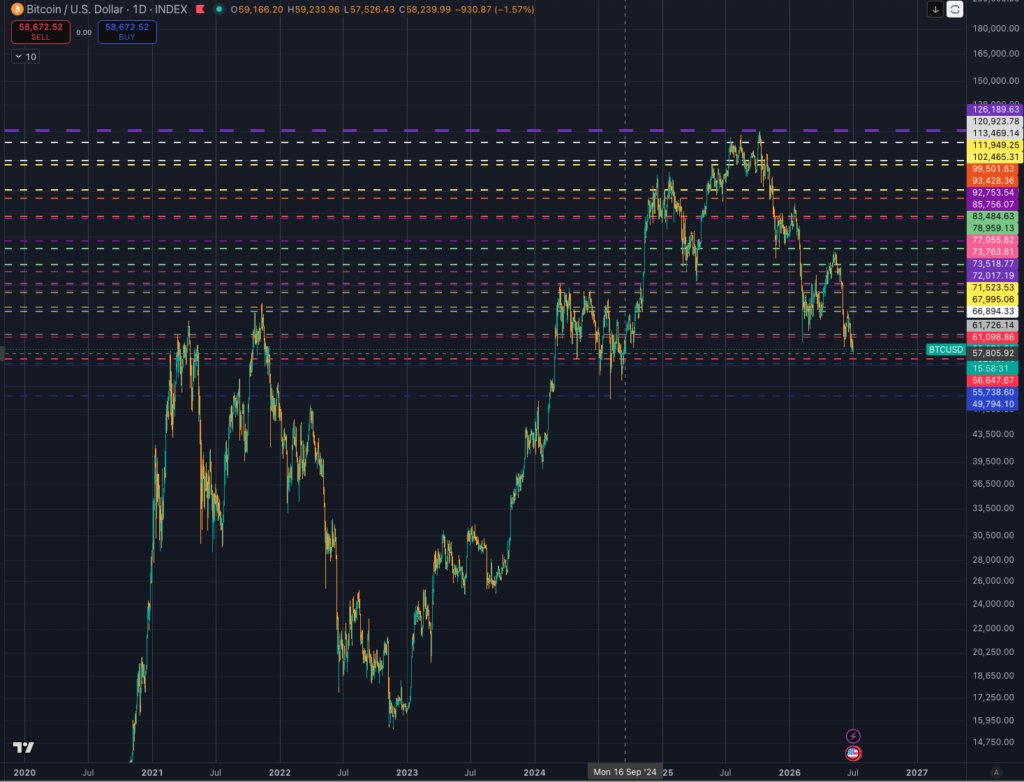
Finally, the $49,000 target represents a psychological "clearing" event. For many long-term investors, a return to these levels would represent a reset of the current cycle, potentially flushing out speculative excess and providing a more sustainable foundation for the next leg of the bull market. Whether this level acts as a trampoline for a recovery or a trapdoor to further losses will depend on the market’s ability to absorb the current "stress stack" in the coming weeks.
As the market enters the second half of the year, the focus remains on whether buyers will step in to defend the mid-$50,000 shelves or if the deterioration of underlying flows will necessitate a deeper exploration of the $49,000 cycle-low map. For now, the framework remains a live guide for risk management in an increasingly uncertain environment.