

 admin
admin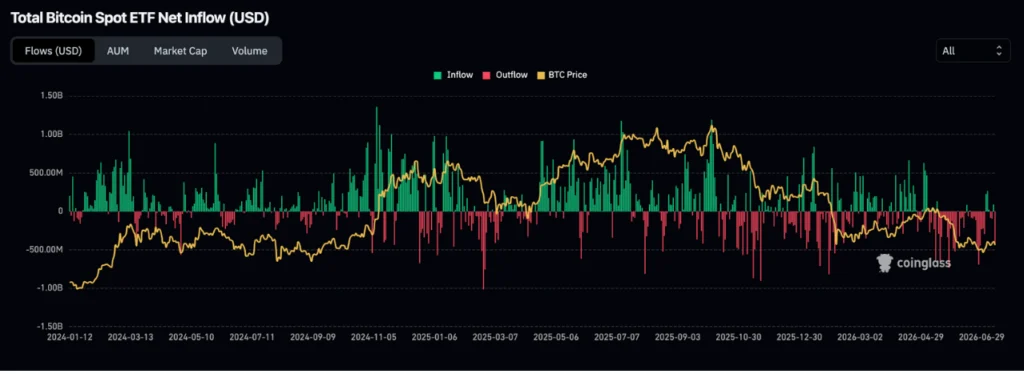
Bitcoin, the world’s largest cryptocurrency by market capitalization, is currently navigating a pivotal juncture, approaching one of the most rigorously observed long-term technical levels in institutional crypto analysis. According to Jurrien Timmer, Fidelity Investments’ Director of Global Macro, after enduring several months of persistent selling pressure, Bitcoin is trading in close proximity to the lower boundary of Fidelity’s proprietary Bitcoin Power Law model. This specific support zone has historically coincided with every major market bottom observed since 2015, signaling a potential shift from speculative excess to a phase of long-term accumulation. While Timmer advises caution, noting that the market may not have definitively reached its ultimate low, he emphasizes that the asset has entered an area traditionally associated with strategic buying by patient investors. However, a critical caveat remains: the readiness of global liquidity conditions to underpin and sustain the next significant rally.
Fidelity’s Power Law Model: A Historical Compass for Bitcoin’s Trajectory
Unlike conventional valuation frameworks that often rely on fixed market cycles or traditional financial metrics, the Bitcoin Power Law model offers a unique perspective by attempting to delineate Bitcoin’s long-term price trajectory through the lens of logarithmic growth. This analytical framework charts Bitcoin’s entire trading history within a set of three gradually ascending curves. These include an upper resistance band, which has historically marked peaks preceding significant corrections; a central trendline, widely interpreted as representing Bitcoin’s fair value over time; and a crucial lower support boundary. It is this lower support boundary that has consistently served as the floor for previous bear markets, providing a reliable indicator of capitulation phases before multi-year recoveries commenced.
As per Timmer’s most recent analysis and accompanying chart, this vital lower support level is currently positioned around $58,000. With Bitcoin presently trading near $62,700 as of the reporting period, the asset finds itself less than 10% above a price point that has historically marked major turning points in its market cycles. This narrow margin underscores the immediate relevance of the Power Law model’s current readings.
The model’s consistency over the past decade has been particularly notable. During the severe bear market of 2015, Bitcoin’s price found its bottom only marginally below the projected support curve, initiating a subsequent prolonged uptrend. Similar price behavior was observed during the intense capitulation phases of 2018 and 2022. In both instances, Bitcoin’s price stabilized remarkably close to the Power Law floor before embarking on robust, multi-year recovery periods that saw new all-time highs. While no technical model can unequivocally guarantee future performance, this consistent historical alignment has cemented the Power Law as one of the more widely recognized and followed long-term valuation frameworks among a growing cohort of institutional investors seeking clarity in the volatile cryptocurrency market. Its ability to provide a macro-level perspective on Bitcoin’s intrinsic value, detached from short-term market noise, renders it a valuable tool for strategic positioning.
Emerging Accumulation Signals Echoing Past Market Bottoms

Beyond the immediate proximity to the Power Law’s lower support line, Jurrien Timmer’s analysis further highlights two supplementary indicators that have reached levels previously associated with historical Bitcoin cycle lows, reinforcing the thesis of an impending accumulation phase.
The first key indicator measures Bitcoin’s percentage deviation from its long-term Power Law trendline, which represents its fair value. This reading has recently plummeted to approximately -56%, firmly placing the asset within what Fidelity has termed the "accumulation zone." Such extreme negative deviations have been rare, having occurred only during the significant market bottoms of 2018 and 2022, periods that proved to be opportune entry points for long-term investors. This metric suggests that Bitcoin is currently significantly undervalued relative to its historical growth trajectory, making it attractive for those with a multi-year investment horizon.
A second compelling indicator compares Bitcoin’s performance against that of gold over a rolling 52-week period. The Bitcoin-to-gold ratio has sharply declined to roughly -100%, implying that Bitcoin has substantially underperformed the traditional safe-haven asset over the past year. Historically, such extreme readings in this ratio have emerged precisely when investor sentiment toward Bitcoin reached its nadir, characterized by widespread pessimism and fear. Paradoxically, these very periods of maximum pessimism have often coincided with quiet, strategic accumulation by long-term buyers, who view the underperformance as a temporary dislocation rather than a fundamental flaw. This divergence suggests a rotation of capital away from riskier assets like Bitcoin towards more perceived stable alternatives, a dynamic often seen at the tail end of bear market cycles.
An important characteristic embedded within the Power Law model itself is that its support levels are not static; they gradually rise over time. This dynamic implies that Bitcoin does not necessarily need to experience another sharp capitulation to precisely touch the $58,000 mark for the support test to be completed. Should prices enter a period of prolonged consolidation, trading sideways while the underlying support curve gradually ascends, the market could still fulfill the historical pattern. This scenario would allow the market to establish a floor through time and price stability rather than through another dramatic decline, offering a less volatile path to recovery.
Global Liquidity: The Elusive Catalyst for a Sustained Rally
Despite the compelling technical setup and the historical robustness of Fidelity’s Power Law model, Timmer has exercised deliberate caution, refraining from definitively declaring that Bitcoin has reached its absolute bottom. His primary concern, and indeed the overarching macroeconomic factor, revolves around global liquidity conditions.
According to Timmer, the substantial speculative premium that propelled Bitcoin beyond $120,000 during the euphoric rally of the preceding year has largely dissipated. This premium was fueled by an abundance of cheap money and heightened risk appetite in financial markets. Concurrently, there has been a noticeable slowdown in global money supply growth, a critical metric that measures the total amount of currency in circulation. This reduction in the overall pool of excess liquidity typically available in the financial system directly impacts risk assets like cryptocurrencies, which thrive on easy money conditions. Without a renewed expansion of the global money supply or a significant improvement in broader financial conditions, Bitcoin could conceivably remain range-bound near its long-term support zone for an extended period before any meaningful, sustained recovery can gather momentum.

This cautious perspective aligns well with historical observations from previous Bitcoin bear markets. The market bottoms experienced in 2015, 2018, and 2022 were not characterized by immediate, V-shaped rebounds. Instead, Bitcoin typically spent several months, sometimes even over a year, trading sideways within a consolidation range. This protracted period allowed market sentiment to reset, weak hands to be flushed out, and, crucially, for improving macroeconomic conditions to lay the groundwork for a new bull market to emerge. These past cycles underscore that while technical support levels identify potential accumulation zones, the broader economic environment often dictates the timing and strength of the subsequent recovery.
Capital Rotation: A Shifting Landscape for Institutional Investments
Another significant observation gleaned from Timmer’s comprehensive analysis is that institutional capital, while seemingly less focused on Bitcoin, has not vanished entirely from the broader financial landscape. Instead, it has demonstrably rotated to other asset classes perceived as more attractive under current market conditions.
Fidelity’s research indicates a clear pattern of capital rotation. Initially, as macroeconomic uncertainty began to intensify, speculative investors demonstrated a discernible shift from Bitcoin into gold. This movement reflects a classic flight to safety, where gold, a traditional store of value, became a preferred hedge against inflation and economic volatility. More recently, this capital rotation has continued, with funds now flowing predominantly toward sectors offering stronger earnings momentum and perceived growth prospects. Semiconductor stocks and artificial intelligence (AI) companies have emerged as prime beneficiaries of this reallocation, attracting substantial institutional investment due to their robust technological advancements and promising future outlooks.
This dynamic rotation of capital provides a crucial explanation for why Bitcoin has struggled to maintain upward momentum, even amidst continued institutional adoption through the launch and growing popularity of spot Bitcoin Exchange-Traded Funds (ETFs) and an increasing corporate interest in digital assets. While short-term momentum traders, who typically chase rapid gains, have largely exited the Bitcoin market, there is evidence that longer-term, conviction-based investors are quietly accumulating positions. On-chain analytics from reputable firms, including Coinglass, have consistently shown sustained buying activity among larger Bitcoin holders—often referred to as "whales" or institutional entities—during periods of recent price weakness. This accumulation by strong hands, even as overall market sentiment remained subdued, suggests a foundational belief in Bitcoin’s long-term value proposition, despite the prevailing macro headwinds. The data from Total Bitcoin Spot ETF Net Inflow (USD) also illustrates periods of renewed institutional interest, albeit intermittently, reinforcing the idea of a selective accumulation rather than a wholesale abandonment.
The Enduring Significance of the Power Law in Bitcoin Valuation
The Bitcoin Power Law model has garnered considerable attention within the financial community, not solely because of its predictive power in identifying potential market bottoms, but equally for its historical accuracy in highlighting both extremes of market sentiment. During previous bull markets, Bitcoin’s price repeatedly approached the model’s upper resistance boundary, signaling periods of extreme euphoria and overextension, which were subsequently followed by significant price corrections. Conversely, the lower boundary has consistently marked periods where downside risk became increasingly limited, presenting an asymmetric risk-reward profile favoring long-term upside potential.

This inherent symmetry in the framework, its ability to signal both overheating and undervaluation, lends it greater credibility compared to models that exclusively focus on bullish price projections or are only relevant during specific market phases. It offers a more holistic view of Bitcoin’s valuation cycle.
Nevertheless, Jurrien Timmer readily acknowledges that the Power Law should be interpreted as a broad valuation framework rather than a precise timing tool for market entry or exit. It is also important to note that different analysts, employing slightly varied methodologies and data sets, can produce marginally different versions of the model. This can result in current support levels being projected anywhere between approximately $51,000 and $58,000. However, for long-term investors focused on Bitcoin’s fundamental growth and adoption over several years, these minor discrepancies in exact price points are often less significant than the broader, overarching conclusion: Bitcoin is currently trading much closer to historically attractive valuation levels than it was during the euphoric highs of the previous year, when speculative froth was at its peak. This perspective encourages a disciplined, value-oriented approach to investing in the asset.
Navigating the Path Forward: Key Indicators for Investors
The ultimate trajectory of Bitcoin—whether it firmly finds support around its current levels or experiences further consolidation—will likely hinge less on technical analysis alone and more significantly on the evolution of broader macroeconomic conditions. Investors seeking to navigate this complex environment should closely monitor several key indicators over the coming months to gauge the potential for a sustained recovery.
Foremost among these is global money supply growth. A resurgence in central bank liquidity injection or a general loosening of monetary policy globally would provide a crucial tailwind for risk assets. Similarly, changes in Federal Reserve policy expectations, particularly regarding interest rates and quantitative easing/tightening, will exert substantial influence on market sentiment and capital flows. Institutional ETF flows, as tracked by platforms like Coinglass, will serve as a direct measure of institutional demand and confidence in Bitcoin. Finally, monitoring the Bitcoin-to-gold ratio will offer insights into the ongoing capital rotation dynamics and the prevailing risk appetite among investors.
A sustained and unambiguous recovery in global liquidity would substantially strengthen the historical case put forth by Fidelity’s Power Law model, providing the necessary fuel for Bitcoin to break out of its current consolidation phase. Until such macroeconomic catalysts materialize, Bitcoin may continue to behave as Timmer suggests: drifting near its long-term support, oscillating within a range, while patient and strategic investors quietly accumulate positions, positioning themselves for the next potential bull run.
In summary, the Power Law model, while not promising an immediate and absolute bottom for Bitcoin, unequivocally indicates that the market has once again entered a region where previous cycles transitioned from periods of fear and capitulation toward long-term opportunity. This transition, however, is often a process that unfolds over months rather than days, demanding patience and a keen eye on the evolving global financial landscape.