
The trajectory of Bitcoin (BTC)’s next significant price breakout appears increasingly tied to evolving dynamics within Binance’s exchange flows and its burgeoning derivatives market. Recent on-chain data emanating from the world’s largest cryptocurrency exchange reveals a complex interplay of cooling whale deposits, a sustained increase in BTC withdrawals, and the growing dominance of futures trading. These interwoven trends are providing crucial signals that could dictate Bitcoin’s immediate and medium-term price direction, particularly as the market navigates a critical consolidation phase following its recent all-time highs.
Cooling Whale Activity After February’s Selling Spikes
A key indicator under scrutiny is the Bitcoin exchange whale ratio on Binance. This metric, which meticulously tracks the ten largest inflows relative to total exchange deposits, witnessed a pronounced surge above 0.60 in early February. Such a spike is typically interpreted as a strong signal of significant selling pressure from large holders, often referred to as "whales," as they move substantial amounts of BTC onto exchanges, presumably to realize profits or reduce exposure. This period coincided with heightened volatility and some price retracement, underscoring the immediate impact of whale movements.
However, the landscape has notably shifted since then. The 14-day moving average of this ratio has since receded and stabilized closer to the 0.45 mark. This level is more in line with what was observed throughout much of 2024 and even projected into 2025, suggesting a return to more normalized whale behavior. The significant drop in these large inflow spikes indicates a reduction in dominant sell-side transfers entering Binance. In simpler terms, fewer large holders are actively moving their Bitcoin to the exchange for immediate sale, contributing to a more balanced supply-demand dynamic on the sell side.
Crucially, this cooling of overt selling pressure from whales has coincided with Bitcoin’s price stabilizing within the robust $65,000-$72,000 range. Instead of extending the decline witnessed after the February spike, the market has demonstrated remarkable resilience, absorbing selling pressure and holding these key levels. This stabilization suggests that while some profit-taking occurred, the underlying demand structure has been strong enough to prevent a deeper correction.
Adding another layer of complexity to whale behavior, crypto analyst CW highlighted through the Cumulative Volume Delta (CVD) indicator that some whales might still be actively accumulating. The CVD measures the net difference between aggressive market buys and sells, providing insight into the true directional pressure from traders. Persistent whale buying during Bitcoin’s recent consolidation, despite the price moving sideways, implies that larger participants are strategically absorbing available supply without triggering rapid price acceleration. This "stealth accumulation" suggests a bullish long-term outlook among these influential entities, patiently building positions without creating immediate upward price spikes that could attract unwanted attention or higher entry costs. This phenomenon is often observed when smart money positions itself ahead of anticipated future price appreciation, leveraging periods of market calm.
Rising BTC Outflows and Dwindling Exchange Supply
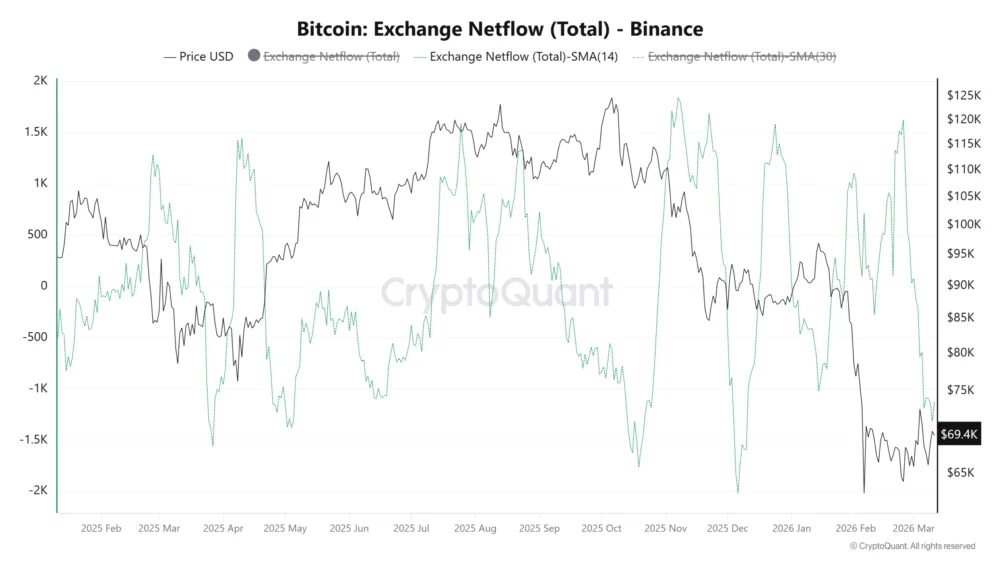
Complementing the shift in whale behavior is a significant change in Binance’s exchange netflow. The total netflow metric tracks the aggregate difference between the total amount of cryptocurrencies entering and leaving an exchange. Since mid-February, this indicator for Bitcoin on Binance has consistently moved deeper into negative territory. By March 11, the 14-day moving average registered a substantial outflow of -1,151 BTC.
This sustained wave of Bitcoin withdrawals from the platform is a particularly potent signal. A negative netflow signifies that more Bitcoin is leaving the exchange than entering it, effectively reducing the immediate supply available for selling on the open market. When investors withdraw BTC from exchanges, they often move it to personal wallets for long-term holding (HODLing) or to cold storage, signaling an intent to hold rather than trade. This behavior typically indicates growing confidence in Bitcoin’s future price appreciation and a decrease in sell-side liquidity. A shrinking supply on exchanges, coupled with consistent demand, creates a favorable environment for potential price increases, as buyers may find it harder to acquire large quantities without moving the market. Historically, periods of sustained exchange outflows have often preceded significant upward price movements for Bitcoin.
Derivatives Dominance and Anticipated Volatility
Simultaneously with these evolving on-chain flows, derivatives activity on Binance has seen a marked expansion. Crypto analyst Maartunn’s observations reveal that the futures-to-spot trading volume ratio on Binance has surged to approximately 5.3. This represents its highest level since October 2023, indicating that the volume in futures markets is now more than five times that of spot trading.

The growing dominance of futures activity carries significant implications. A higher futures-to-spot ratio suggests that traders are increasingly employing leverage to speculate on Bitcoin’s future price movements. While this can amplify gains, it also significantly increases exposure to volatility and the risk of liquidations. This trend often signals that market participants are bracing for heightened BTC price volatility, attempting to capitalize on anticipated large swings. The leverage inherent in futures trading can act as both a catalyst for rapid price movements and a source of market instability, as large liquidation cascades can exacerbate price swings in either direction. Understanding the sentiment and positioning within the derivatives market becomes crucial for gauging potential short-term price action. Other derivatives metrics, such as funding rates (the cost of holding a long or short position) and open interest (the total number of outstanding derivatives contracts), would provide further insights into market sentiment and potential areas of liquidity. High positive funding rates, for instance, often indicate an overheated bullish sentiment that can precede a price correction or "long squeeze."
Improving Spot Demand and Market Resilience
Beyond Binance-specific data, broader market indicators corroborate the strengthening demand. Coinbase research highlighted an improving Spent Output Profit Ratio (SOPR) for short-term holders, which has turned higher since late February. The SOPR is a powerful on-chain metric that assesses whether coins moved on-chain were moved in profit or loss. A SOPR value above 1 indicates that, on average, coins are being spent at a profit, while a value below 1 indicates a loss.
For short-term holders (those who have held Bitcoin for less than 155 days), a recovery in SOPR above 0 across both Bitcoin and Ether (ETH) is a significant positive signal. It indicates that recent demand has been robust enough to absorb the selling pressure from newer traders, who are typically more susceptible to panic selling during price dips. When short-term holders are able to sell their coins for a profit (SOPR > 1) or at least without significant loss (SOPR > 0), it suggests underlying strength in demand that is preventing further price declines and helping to stabilize the BTC price within its current consolidation range. This ability of the market to absorb selling from newer participants without breaking down is a testament to the resilience and growing conviction among longer-term holders and institutional players.
Broader Market Context: Halving, ETFs, and Macro Factors
These granular on-chain signals from Binance do not exist in a vacuum. They are intricately woven into a broader market narrative influenced by several significant factors. The impending Bitcoin halving event, expected in April 2024, stands as a monumental catalyst. Historically, halvings, which cut the supply of newly minted Bitcoin in half, have preceded significant bull runs due to the enforced scarcity. The current accumulation and consolidation phase could be seen as market participants positioning themselves ahead of this supply shock.

Furthermore, the introduction of spot Bitcoin Exchange-Traded Funds (ETFs) in the United States in January 2024 has fundamentally altered Bitcoin’s market structure. These ETFs have opened the floodgates for institutional capital, providing a regulated and accessible avenue for traditional investors to gain exposure to Bitcoin. The consistent inflows into these ETFs since their launch have demonstrated a new, robust source of demand, acting as a powerful counterweight to any potential selling pressure. The ongoing accumulation by these institutional vehicles likely plays a significant role in the market’s ability to absorb supply and maintain its current price levels, even as retail interest fluctuates.
Macroeconomic conditions also cast a long shadow. Global interest rates, inflation trends, and central bank policies continue to influence the broader risk-on/risk-off sentiment. While Bitcoin has shown some decoupling from traditional markets, it remains sensitive to liquidity conditions and investor appetite for risk. A more dovish stance from central banks or a perceived end to the tightening cycle could provide further tailwinds for risk assets, including Bitcoin.
Implications and Outlook: Navigating the Consolidation Phase
The confluence of these factors paints a nuanced picture of Bitcoin’s current consolidation phase. The cooling of aggressive whale selling on Binance, coupled with sustained BTC outflows and robust short-term holder demand (as indicated by SOPR), points towards a market that is actively absorbing supply and potentially building a base for its next major move. The dominance of futures trading, while signaling anticipated volatility, also reflects heightened speculative interest and potentially leveraged bets on future price appreciation.
The current price range of $65,000-$72,000 is therefore a critical battleground. If Bitcoin can decisively solidify the $70,000 level as strong support, it would reinforce the bullish narrative and suggest that the market is preparing for a sharper repricing to the upside. This could involve a sustained breakout towards new all-time highs, potentially targeting the $80,000 mark as some analysts have suggested, or even higher, in line with long-term projections like Bitwise CIO’s view that Bitcoin could reach $1 million if it follows gold’s trajectory in the "store of value" market.
However, the path forward is not without significant hurdles. A sustained failure to break above the formidable $72,000 resistance level over the coming days or weeks could trigger an alternative scenario. If repeated attempts to breach this ceiling are met with strong selling pressure, it could confirm a "bull trap" – a false breakout signal that entices buyers only to reverse sharply. In such a scenario, if history were to repeat, the market could witness the next leg down, leading to a deeper correction as leveraged long positions are liquidated and sentiment sours.

Ultimately, the interplay of these on-chain metrics, market structure changes, and broader macroeconomic factors will dictate Bitcoin’s immediate future. The data from Binance, a central hub for cryptocurrency trading, offers invaluable insights into the behavior of key market participants and the underlying health of Bitcoin’s supply-demand dynamics. As the market continues to consolidate, vigilant monitoring of these indicators will be paramount for understanding whether Bitcoin is poised for its next major ascent or a period of renewed caution.
This article does not contain investment advice or recommendations. Every investment and trading move involves risk, and readers should conduct their own research when making a decision. While we strive to provide accurate and timely information, Cointelegraph does not guarantee the accuracy, completeness, or reliability of any information in this article. This article may contain forward-looking statements that are subject to risks and uncertainties. Cointelegraph will not be liable for any loss or damage arising from your reliance on this information.