

 admin
admin
Bitcoin (BTC) has recently found itself in a tenacious struggle to firmly establish the $80,000 psychological and technical level as a foundational support. While breaching this threshold has proven challenging in recent days, comprehensive new research indicates that the true gauntlet for bulls lies just beyond, within a formidable overhead liquidity structure ranging from $81,000 to $86,000. This critical corridor, according to leading crypto analytics firm Glassnode, represents a pivotal test of market demand and investor conviction, potentially determining the trajectory of Bitcoin’s price action in the coming weeks and months. The confluence of various on-chain metrics and technical indicators within this narrow band suggests a concentrated zone of selling pressure and a significant hurdle that the cryptocurrency must overcome to sustain its upward momentum.
The Current Landscape: A Stalled Ascent Towards New Highs
The cryptocurrency market, and Bitcoin in particular, has witnessed periods of significant volatility and recovery throughout 2026, navigating a complex macroeconomic environment characterized by fluctuating interest rates, inflation concerns, and evolving investor sentiment towards risk assets. After experiencing a notable drawdown earlier in the year, Bitcoin embarked on a recovery rally, gradually reclaiming key price levels. The push towards and past $80,000 represented a significant milestone, reigniting optimism among many market participants who had endured a prolonged period of consolidation or decline. However, the inability to decisively flip this $80,000 mark from resistance to robust support has introduced an element of caution. This hesitation signals that while buying pressure exists, it is being met with substantial selling interest, preventing a clear breakout. The market is now at a critical juncture, where the sustainability of the recent recovery is being rigorously tested.
Glassnode’s Deep Dive: Unpacking the $81,000-$86,000 Resistance Zone
In its latest edition of the widely respected newsletter, "The Week Onchain" (Week 34, 2026), Glassnode, a prominent on-chain analytics platform renowned for its granular insights into blockchain activity, highlighted several layers of potential selling pressure. These "key overhead liquidity structures" are not merely speculative predictions but are derived from the immutable data embedded within the Bitcoin blockchain and observable market mechanics. Glassnode’s methodology involves analyzing wallet behavior, transaction patterns, and order book dynamics to identify significant concentrations of supply that could enter the market. The firm’s analysis points to a formidable barrier between $81,000 and $86,000, a range where various cohorts of holders and market participants are poised to take profits or minimize losses, thereby exerting downward pressure on the price.

The Resolve of Long-Term Holders: A Defining Moment
Of paramount interest in Glassnode’s assessment are the Long-Term Holders (LTHs). These are defined as wallets that have held Bitcoin without selling for a minimum of six months, often extending to several years. LTHs are generally considered the "strong hands" of the market, exhibiting high conviction and a long-term investment horizon. They are typically less susceptible to short-term price fluctuations and are known for accumulating Bitcoin during periods of weakness. However, even these resilient investors have a breaking point, particularly when prices return to their original acquisition costs after a significant downturn.
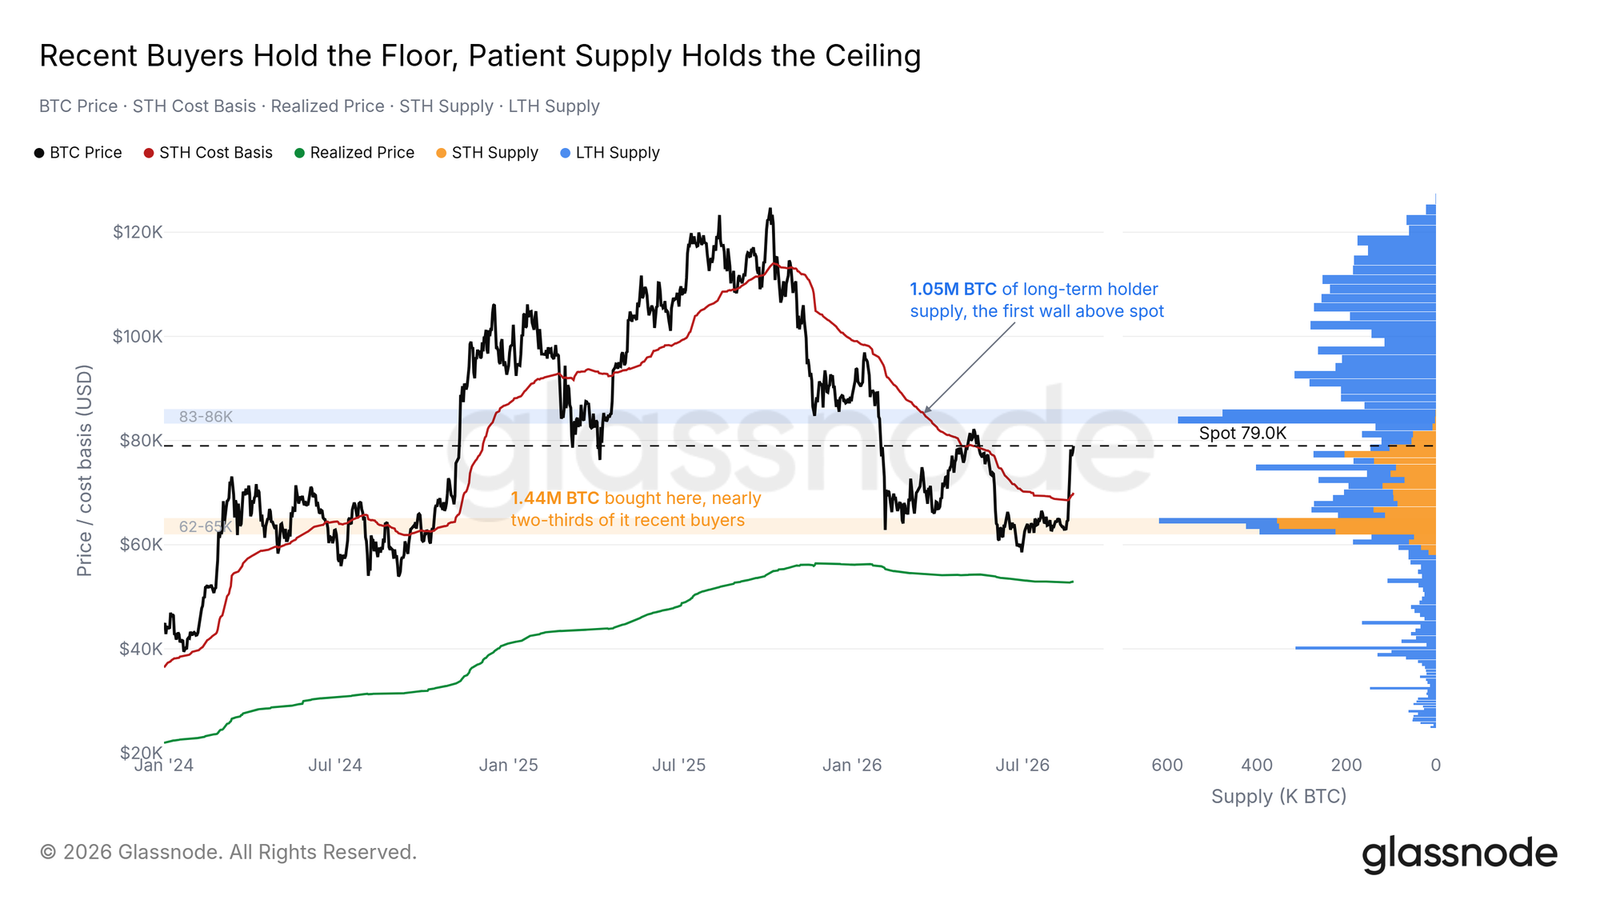
Glassnode specifically notes that a substantial portion of this overhead supply, particularly within the $83,000-$86,000 range, belongs to LTHs who have weathered the entirety of the preceding market drawdown. For many of these long-term investors, a return to the $83,000-$86,000 level would mean an opportunity to sell at or near their breakeven price. After enduring potentially significant unrealized losses during the market’s decline, the psychological urge to "get out even" can be incredibly powerful. This dynamic creates a "patient-supply wall," as Glassnode terms it, where a large volume of Bitcoin is held by individuals waiting for an opportune moment to exit their positions without incurring a loss. Should Bitcoin’s price ascend into this zone, it would directly challenge the resolve of this LTH cohort, testing their willingness to continue holding or to realize their investment. The outcome of this test could have profound implications for market liquidity and the sustainability of any further upward movement.
The implications of LTHs potentially selling at breakeven are significant. Historically, periods where long-term holders distribute their holdings have often coincided with local tops or pauses in upward trends. While their selling is not necessarily indicative of a bear market, it does signify a reduction in conviction or a strategic rebalancing of portfolios. The attached image illustrating "BTC supply distribution by wallet cohort" (Source: Glassnode) would visually support this distribution, showing a concentration of LTHs at specific price levels that correlate with their cost basis.
Multifaceted Resistance: A Convergence of Market Dynamics
Beyond the LTH supply, Glassnode’s analysis reveals a complex interplay of other market forces converging within the $81,000-$86,000 band, further solidifying its status as a critical resistance zone. These elements include:
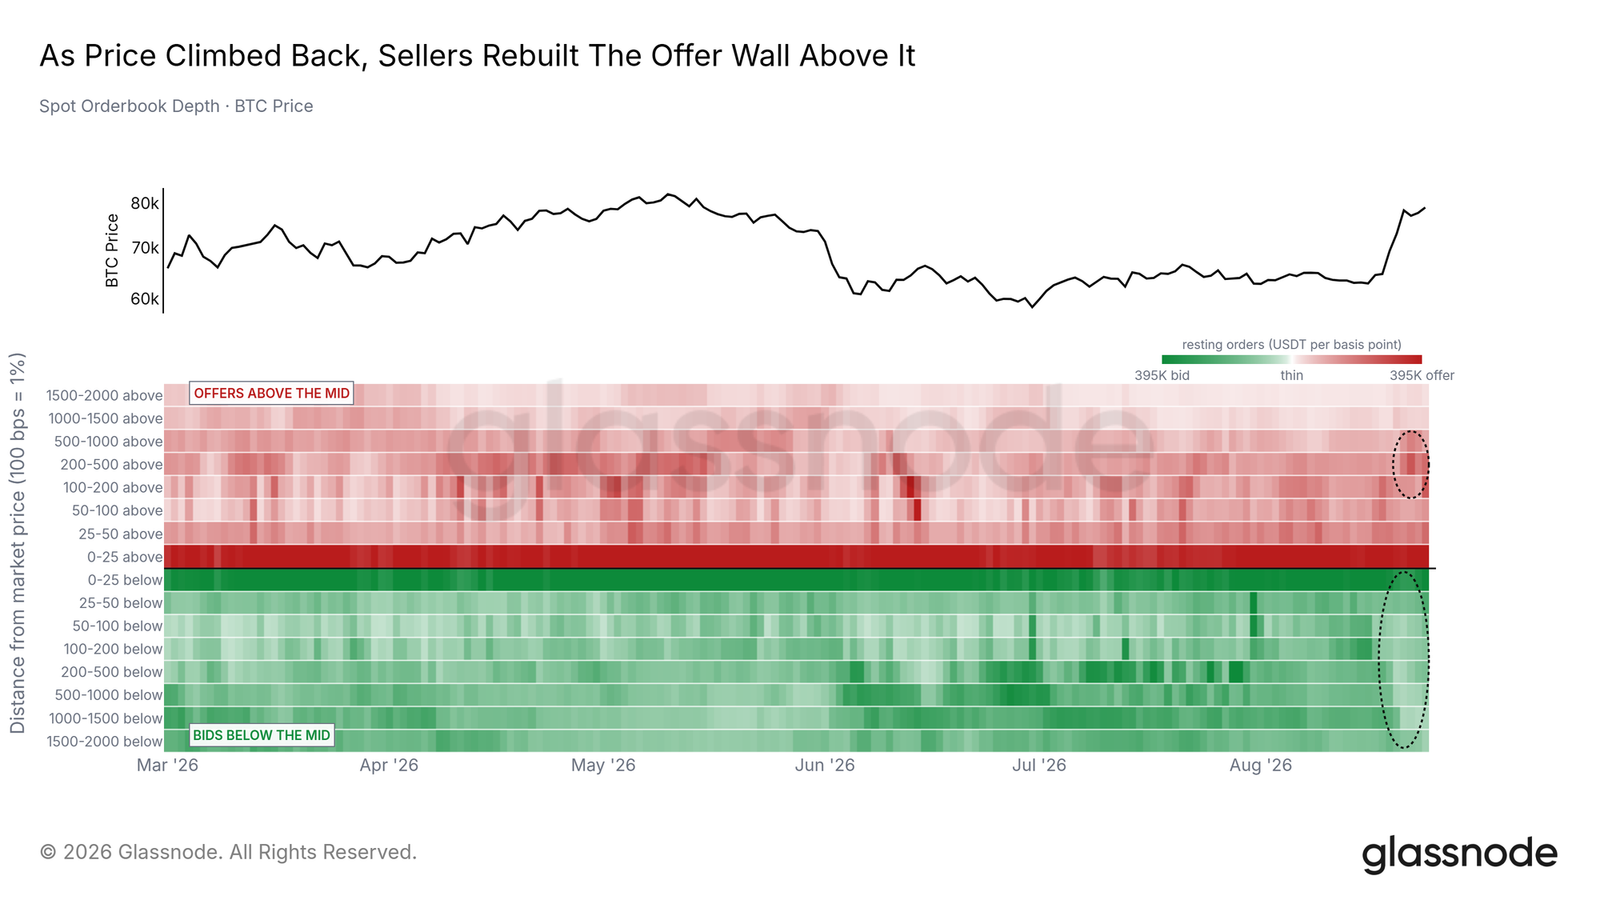
- New Ask Liquidity on Exchange Order Books: As Bitcoin’s price approaches previous highs or significant psychological levels, new sell orders, known as "asks," tend to appear on exchange order books. These represent fresh supply entering the market. Glassnode observes that a significant amount of new ask liquidity has emerged in this zone. While some of these orders may be genuine attempts to sell, others might be "spoofing" attempts, where large orders are placed with no intention of being filled, merely to create the illusion of strong resistance and deter buying. Nevertheless, their presence adds to the perceived selling pressure. The "BTC spot order-book heatmap" (Source: Glassnode) would visually represent these dense clusters of sell orders, illustrating the depth of the resistance.
- Self-Custody Cost-Basis Shelf at $80.8K: This metric refers to the aggregate cost basis of Bitcoin held in self-custody wallets, specifically those acquired around the $80,800 mark. For holders who purchased at these levels and moved their BTC off exchanges, a return to this price point offers them an opportunity to break even. Similar to LTHs, this group might be inclined to sell, especially if they endured a period of unrealized losses.
- Dealer Gamma Flips Negative at $82.3K: In the options market, "gamma" refers to the rate of change of an option’s delta (its sensitivity to price changes). When dealer gamma flips negative, it implies that options market makers, who typically hedge their positions, will need to sell spot Bitcoin as the price rises to maintain a neutral delta. This dynamic creates a selling impulse in the spot market at specific price levels, in this case, around $82,300, amplifying the overhead resistance.
- Surviving Liquidation Shelf to $86K: This refers to the cascade of forced selling that occurs when leveraged trading positions are closed out due to insufficient margin. If Bitcoin’s price moves upwards, it can trigger the liquidation of short positions that were opened at lower prices, which paradoxically can fuel a brief upward squeeze. However, in this context, a "surviving liquidation shelf" refers to a concentration of remaining short positions or even long positions that might face liquidation on a slight downturn, creating an area where price action could become highly volatile as these orders are triggered. More likely, this refers to a significant level where new short positions could be opened or where existing shorts are targeting to defend, knowing that a move above this could trigger a cascade of short liquidations. The term "shelf" implies a structural level where significant activity is expected.
Glassnode’s conclusion is stark: "Every overhead structure we track now sits between $81K and $86K; that band is where the recovery’s demand meets its test." This unequivocal statement underscores the gravity of the current situation, positioning this price range as the ultimate proving ground for Bitcoin’s ongoing recovery.
Technical Indicators Reinforce Resistance
Beyond on-chain data, traditional technical analysis also paints a picture of concentrated resistance around the $80,000 mark. Several key trend lines and moving averages have converged within a narrow corridor, strengthening its status as a formidable hurdle for bulls.
- 50-week and 100-week Exponential Moving Averages (EMAs): These long-term moving averages are widely used by traders and analysts to identify the prevailing trend. The 50-week EMA, a medium-term trend indicator, currently sits at approximately $77,353, while the 100-week EMA, a longer-term trend indicator, is positioned around $78,485, according to data from TradingView. The fact that Bitcoin is trading in close proximity to, and often struggling to decisively breach and hold above, these significant weekly EMAs highlights the difficulty in establishing a clear bullish trend.
- 365-day Volume-Weighted Average Price (VWAP): The 365-day VWAP, a sophisticated moving average that incorporates trading volume into its calculation, currently hovers around $82,600. VWAP is particularly favored by institutional traders and large-scale investors as it provides a more accurate representation of the average price at which an asset has traded over a given period, weighted by volume. The convergence of the 365-day VWAP with Glassnode’s identified overhead liquidity zone further emphasizes the significance of the $81,000-$86,000 band. For institutional players, clearing the VWAP is often a prerequisite for strong bullish conviction and sustained buying. The attached "BTC/USD one-day chart with 50-week, 100-week EMA; 365-day rolling VWAP" (Source: Cointelegraph/TradingView) would visually depict these converging lines, illustrating the technical pressure points.
The convergence of these distinct technical indicators—EMAs and VWAP—within the immediate vicinity of the $80,000 to $86,000 range creates a formidable technical barrier. Each indicator individually represents a significant point of interest for different market participants, and their alignment suggests a consensus among various analytical approaches regarding the strength of this resistance.
Market Sentiment and Analyst Perspectives: Caution Amidst Recovery
The broader market sentiment surrounding Bitcoin’s recent recovery has been characterized by a blend of cautious optimism and lingering skepticism. While the bounce from lower levels has been welcomed, many participants remain wary of its sustainability. Cointelegraph previously reported on this skepticism, highlighting concerns about whether Bitcoin’s rapid rebound possessed the underlying strength to endure.
Prominent trader and analyst Rekt Capital, for instance, has repeatedly stressed the importance of Bitcoin holding its 50-week EMA for an extended period before any meaningful and sustained trend change can be definitively declared. His analysis often points to historical patterns and market cycles, suggesting that "bear market timing" might continue until the end of 2026. This perspective implies that while temporary rallies are possible, the overarching market structure might still be conducive to further consolidation or even deeper corrections before a true bull market resumes.
For institutional investors, this period of concentrated resistance and uncertain short-term direction often leads to a "wait and see" approach. Large capital flows tend to be deployed once clearer signals emerge, either a decisive breakout above major resistance or a retest of strong support levels. Retail traders, on the other hand, might experience heightened emotional swings, from euphoria during rallies to fear during pullbacks, particularly as the market tests such critical psychological and technical levels.
Implications for Bitcoin’s Future Trajectory
The battle for the $80,000 to $86,000 zone carries significant implications for Bitcoin’s near-term and potentially long-term price trajectory.
- Immediate Outlook: A failure to decisively break through and hold above this resistance band could lead to a period of consolidation, or even a retracement to retest lower support levels. This would confirm the strength of the overhead supply and potentially dampen bullish enthusiasm, at least temporarily. Such a scenario might see Bitcoin re-engaging with levels below $75,000 as it seeks stronger foundational support.
- Validation of Demand: Conversely, a successful breach of this multi-layered resistance would be a powerful bullish signal. It would demonstrate that current demand is strong enough to absorb significant selling pressure from long-term holders, new ask liquidity, and other structural resistances. This could pave the way for a more sustained rally towards new all-time highs, as sellers are exhausted and buyers gain confidence.
- Long-Term Market Structure: The outcome of this test will also provide crucial insights into the broader market structure. If the "patient supply wall" from LTHs is effectively cleared, it suggests a renewal of conviction among a new cohort of buyers, or a strategic shift among long-term holders. If, however, the resistance holds firm, it reinforces the idea that the market is still in an accumulation or consolidation phase, potentially extending the "bear market timing" narrative further into 2026.
- Investor Psychology: This period will be a major test of investor psychology. For those who bought at the lows, it’s an opportunity to take profits. For those who bought higher, it’s a chance to break even. The collective decision of these various cohorts will dictate the market’s immediate direction. The emotional landscape of the market will be volatile, with narratives shifting rapidly based on price action within this zone.
In conclusion, while Bitcoin’s journey back above the $80,000 mark has been a positive development for bulls, the real test of its resilience and the strength of the ongoing recovery is now unfolding within the $81,000 to $86,000 corridor. The intricate web of on-chain liquidity structures and converging technical indicators highlighted by Glassnode and other analyses points to a formidable challenge. The market is poised at a critical juncture, where the resolve of long-term holders, the influx of new selling pressure, and the alignment of key moving averages will collectively determine whether Bitcoin can transform this resistance into a springboard for further gains or if it will be forced to retreat and regroup. Investors are advised to conduct thorough independent research and consider the inherent risks associated with all investments and trades in this highly volatile asset class.