
 Dwi Wanna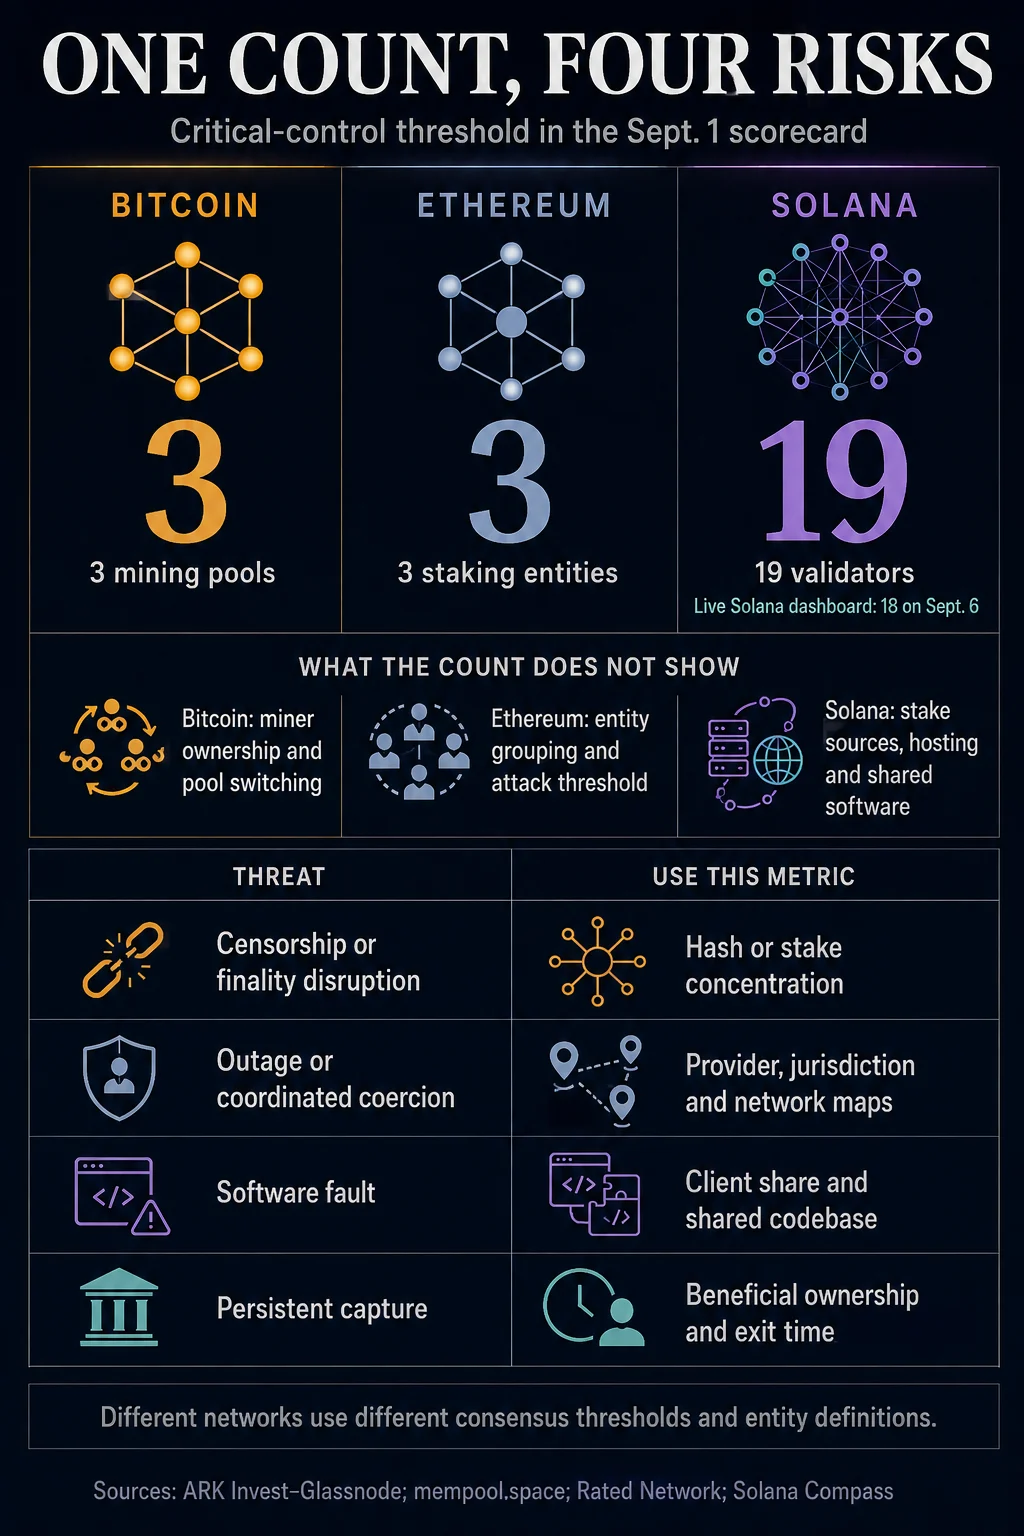
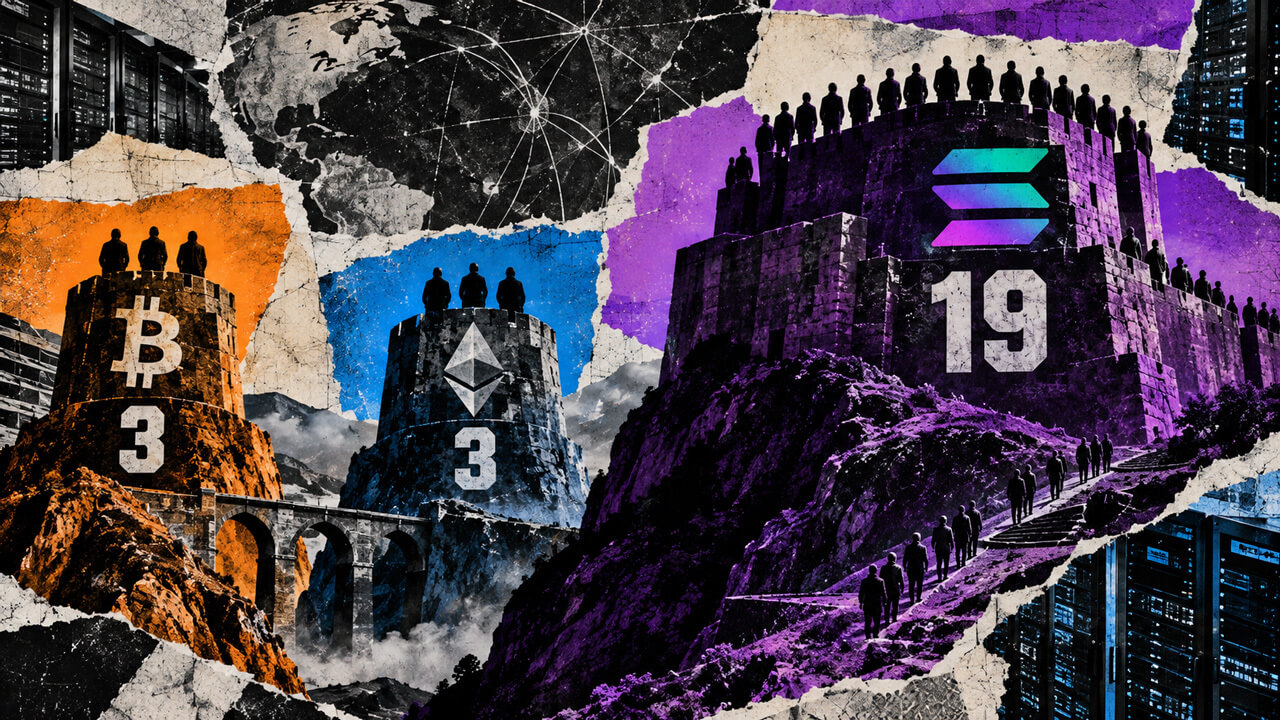
The pursuit of quantifying decentralization has moved from theoretical debate to empirical measurement with the release of a joint scorecard by ARK Invest and Glassnode. Published on September 1, 2026, the report introduces a rigorous framework for assessing "blockchain capture risk," defined as the smallest number of block-production entities required to cross a protocol-relevant control threshold. By analyzing Bitcoin, Ethereum, and Solana, the researchers have established a "Critical Resilience Threshold" that challenges long-standing assumptions about network security. The findings indicate that while Bitcoin and Ethereum require the coordination of only three major entities to disrupt consensus-level activities, Solana requires 19. However, the report’s composite ranking ultimately places Bitcoin at the top of the decentralization spectrum, highlighting the multi-dimensional nature of network health beyond simple entity counts.
Defining the Critical Resilience Threshold
The core of the ARK-Glassnode framework is the "Critical Resilience Threshold" (CRT). This metric identifies the minimum number of dominant actors—whether they be mining pools, staking providers, or validators—that must collude to manipulate a network’s block production or voting power. The researchers argue that for institutional investors and entities considering blockchains as settlement infrastructure, the CRT provides a clearer picture of short-term vulnerability than traditional, more abstract decentralization metrics.
The inputs for this calculation vary significantly by the underlying consensus mechanism of the protocol. For Bitcoin, the metric is weighted by hash rate attributed to mining pools. For Ethereum and Solana, the weighting shifts to the concentration of staked assets. The report emphasizes that while a low CRT number indicates a higher concentration of power, the practical implications of that power are dictated by specific protocol rules and the "exit speed" available to participants.
Bitcoin: The Paradox of Pool Concentration and Physical Dispersion
According to the report, Bitcoin’s CRT stands at three. This figure is derived from the observation that three major mining pools—Foundry USA, AntPool, and F2Pool—collectively control a majority of the network’s hash rate. A seven-day snapshot taken on September 6, 2026, confirmed this concentration: Foundry USA accounted for 26.88% of blocks, AntPool for 16.91%, and F2Pool for 15.25%. Together, these three entities coordinated block templates for 59.04% of the observed production.
However, the ARK-Glassnode analysis makes a vital distinction between mining pool coordination and hardware ownership. While a pool operator selects the transactions for a block, the actual computational work is provided by thousands of independent miners globally. The report notes that individual miners possess high "mobility," with the ability to switch pools or redirect hash rate in approximately 30 seconds by simply updating their hardware settings.
This mobility mitigates the risk of long-term capture. If a mining pool attempted to censor transactions or act maliciously, miners could theoretically defect to a competing pool almost instantaneously. Thus, while the CRT of three highlights a vulnerability regarding short-term censorship and template selection, the ultimate control of the network remains highly dispersed across physical infrastructure that is difficult to seize or coerce simultaneously.
Ethereum: Taxonomy Challenges in the Proof-of-Stake Era
Ethereum’s CRT is also calculated at three, but the nature of this concentration is vastly different from Bitcoin’s. The move to Proof-of-Stake (PoS) has introduced a complex taxonomy of entities, including liquid staking protocols, centralized exchanges, and distributed validator networks. The report identifies Lido, SSV, and Binance as the primary controllers of stake, though it acknowledges that these labels can be misleading.
For instance, data from Rated Network on September 6, 2026, showed Lido holding 21.17% of the stake. However, Lido is not a single operator but a protocol representing 544 distinct underlying entities. This "classification problem" means that while three entities may cross a threshold on paper, the coordination required among the hundreds of operators behind those entities is significantly higher.
The risk profile for Ethereum is further segmented by specific attack thresholds defined in the protocol’s documentation:
- 33% of Stake: Can be used to delay finality, preventing the network from reaching a "permanent" state.
- 50% of Stake: Allows for the censorship of specific transactions and control over short-range fork choices.
- 66% of Stake: Provides the power to finalize a preferred chain and potentially alter finalized history.
The report also highlights "exit speed" as a significant factor for Ethereum. Unlike Bitcoin miners, Ethereum validators face a rate-limited exit queue. Under stressed conditions, withdrawing staked assets can take weeks, meaning that if a staking entity is coerced, the participants’ capital remains "trapped" and subject to the controller’s actions for a longer duration than in a Proof-of-Work system.
Solana: High Thresholds and Infrastructure Trade-offs
Solana presents the highest CRT among the three networks, with 19 validators required to reach the 33.4% voting power threshold necessary to halt consensus. This figure, often referred to as the Nakamoto Coefficient, has shown relative stability. Independent dashboards like Solana Compass recorded a coefficient of 18 on September 6, 2026, while the Solana Foundation’s internal health reports have previously recorded figures as high as 20.
The higher count suggests that Solana is more resilient to a small-scale "room-full-of-people" collusion attack. However, the ARK-Glassnode report points to a different form of concentration: infrastructure. High-throughput networks like Solana require specialized hardware and high-bandwidth connections, which naturally gravitate toward commercial data centers.
Data from 2025 and 2026 indicates that while there are over 400 data centers hosting Solana nodes, a significant portion of the stake is concentrated in a few providers like TeraSwitch and Latitude. This creates a "correlated failure mode," where a single ISP outage or a government mandate targeting a specific data center could impact the network more severely than the CRT of 19 would suggest.
Correlated Risks: Hosting, Software, and Auditability
Beyond the number of entities, the scorecard examines dependencies that can reshape capture risk. These include:
1. Cloud and ISP Concentration
Infrastructure can create hidden links between seemingly separate entities. The report found that approximately 20% of Ethereum nodes run on Amazon Web Services (AWS). While individual node operators may be independent, they are all vulnerable to a single point of failure at the cloud provider level. Bitcoin demonstrates higher geographic resilience in this regard, with a significant percentage of nodes (estimated between 48% and 63%) operating behind Tor to obscure their physical location and protect against jurisdictional coercion.
2. Client Software Diversity
A shared codebase represents a major failure mode. If a majority of a network runs on a single software client, a bug in that code could take down the entire system. Ethereum has made strides in client diversity, with the Geth client’s dominance hovering around 50%. In contrast, Solana has historically relied heavily on the Agave/Jito codebase (92% of stake), though the emergence of the Firedancer and Frankendancer clients is beginning to mitigate this risk.
3. Auditability and Verification
Bitcoin’s top ranking in the composite decentralization index is largely attributed to its auditability. The report argues that the ability for an individual user to run a low-cost node and verify the entire history of the ledger is the ultimate defense against capture. As hardware requirements for nodes increase—as seen in Ethereum and Solana—the "barrier to entry" for independent verification rises, potentially centralizing the power to define the "true" state of the ledger.
Chronology of Network Health (September 2026)
- September 1: ARK Invest and Glassnode release "The Decentralization Spectrum," introducing the CRT metric.
- September 3: Community debate intensifies over the "three-pool" risk in Bitcoin, leading to a surge in interest in decentralized mining protocols like Stratum V2.
- September 6: Live dashboards show minor shifts in metrics. Bitcoin’s top three pools hold 59% of hash rate; Ethereum’s exit queue remains empty with a 24-hour withdrawal estimate; Solana’s Nakamoto Coefficient sits at 18.
- September 10: Analysts note that despite the low CRT for Bitcoin and Ethereum, market liquidity for their respective assets remains the highest in the industry, providing an "economic exit" for users even when protocol exits are congested.
Institutional Implications: Choosing a Survival Metric
For institutional actors, the ARK-Glassnode scorecard serves as a reminder that "decentralization" is not a single number but a spectrum of trade-offs. An institution using a blockchain for high-frequency settlement may prioritize Solana’s high CRT to ensure the network doesn’t halt. Conversely, a central bank or a long-term asset manager may prioritize Bitcoin’s high auditability and rapid exit speed for miners to ensure the integrity of the ledger over decades.
The report concludes that capture risk is dynamic. It is not enough to count the number of validators; one must also understand who supplies the stake, where the machines are physically located, which software they run, and how quickly participants can leave the system under duress. As blockchains move closer to becoming the backbone of global finance, these metrics will likely become as standard as credit ratings are for traditional sovereign debt. The joint effort by ARK and Glassnode represents a significant step toward that maturity, providing a data-driven roadmap for navigating the complexities of the decentralized frontier.