

 admin
admin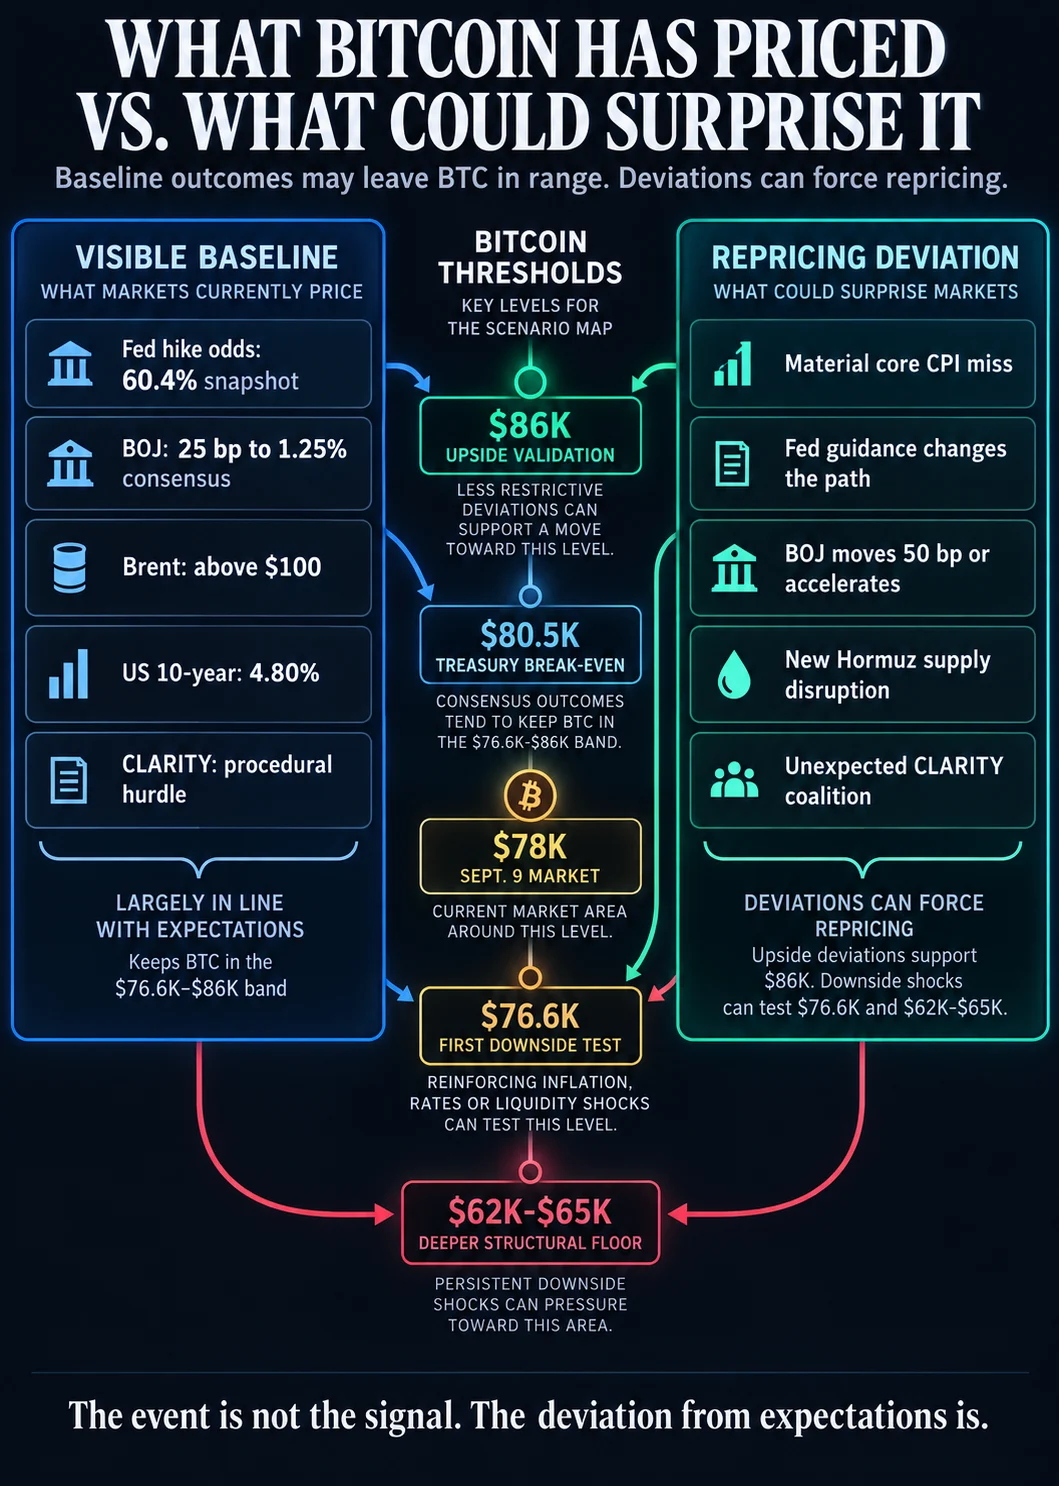
Bitcoin’s current market position, hovering above key support levels despite persistent macroeconomic headwinds, suggests a critical juncture for the cryptocurrency. The digital asset’s resilience is being tested against a backdrop of elevated oil prices, rising Treasury yields, and the ever-present possibility of further central bank tightening. The crucial determinant of Bitcoin’s next significant move will be whether the outcomes of impending economic events align with, or deviate from, the assumptions already embedded in financial markets.
The current environment presents a complex interplay of factors. Brent crude oil has breached the $100 per barrel mark, a significant psychological and economic threshold. Simultaneously, the yield on the U.S. 10-year Treasury note stood at approximately 4.80% as of September 8th, reflecting a heightened cost of borrowing and a generally tighter monetary policy stance. Furthermore, futures markets indicated a notable leaning towards an additional interest rate hike by the U.S. Federal Reserve, a move that would further tighten liquidity. Despite these challenging conditions, Bitcoin has maintained its position above Glassnode’s calculated "True Market Mean" of $76,600 and remains just shy of a dense cluster of cost-basis and liquidation levels. This delicate balance positions Bitcoin at a critical decision point, where upcoming events could either reinforce its current stability or catalyze a significant shift in its market regime.
The coming weeks are poised to deliver a series of economic data releases and central bank decisions that will shape investor sentiment and asset valuations across global markets. The U.S. Consumer Price Index (CPI) report for August, scheduled for release on September 11th, will be a primary focus. Following a July headline CPI of 3.4% year-over-year and a core inflation rate of 2.5%, market participants will be scrutinizing the August figures for any signs of persistent inflationary pressures or a de-escalation. The U.S. Treasury’s yield curve, with the 10-year yield at 4.80% on September 8th, demonstrates that markets are already pricing in a degree of policy tightening. A modest inflation print could alleviate pressure on traders to anticipate increasingly aggressive monetary policy, potentially leading to lower yields. Conversely, a materially hotter core inflation reading could solidify expectations of higher yields and reinforce the case for further Fed action, bringing the $76,600 support level for Bitcoin into sharper focus.
The Federal Reserve’s monetary policy meeting, concluding on September 16th, will follow closely on the heels of the CPI data. Following the August jobs report, CME FedWatch data indicated a 60.4% probability of a September rate hike, an increase from the previous week. However, a Reuters poll conducted between September 4th and 9th revealed that a majority of economists surveyed (65 out of 93) anticipated the Fed would maintain its current benchmark interest rate range of 3.50% to 3.75%. The market’s reaction will likely hinge on not only the decision itself but also the accompanying guidance regarding future policy. A 25-basis-point hike coupled with signals of an extended tightening cycle would represent a significant hawkish development. Conversely, a decision to hold rates steady, alongside a dovish outlook on future hikes, could provide a tailwind for risk assets like Bitcoin.
Adding another layer of complexity, the Bank of Japan (BOJ) is scheduled to convene on September 17th and 18th. Reports suggest a consensus view favors a conventional 25-basis-point interest rate increase to 1.25%, with limited appetite for a more aggressive 50-basis-point move. However, any deviation from this expected path, such as a larger hike or guidance pointing towards a more accelerated tightening cycle, could have significant ripple effects. Such a scenario could lead to a strengthening of the Japanese Yen, potentially triggering capital outflows from yen-funded positions across global markets and impacting overall liquidity and risk appetite, which in turn could affect Bitcoin.
Bitcoin’s Technical Landscape: Key Thresholds and Investor Behavior
Analysis from Glassnode, a prominent on-chain analytics firm, highlights specific price levels that are critical for understanding Bitcoin’s current market dynamics. The report identifies the $83,000 to $86,000 range as a significant overhead band. This zone represents a convergence of several key metrics: the cost basis of long-term Bitcoin holders, the modeled short-liquidation exposure, and the break-even levels for U.S. spot Bitcoin Exchange-Traded Funds (ETFs). Over one million Bitcoin were acquired within this price range, making it a substantial area of potential selling pressure. Glassnode data further indicates that the modeled short-liquidation shelf, spanning from $82,000 to $86,000, experienced a 21% increase after August 19th, underscoring the volatility inherent in these price levels. The estimated break-even point for the ETF complex is also cited as being near $86,000.
Intermediate price levels also hold significance. Corporate treasuries, for instance, tend to break even around $80,500, positioning this as a crucial resistance point just above Bitcoin’s current trading range. Below the immediate market price, Glassnode’s "True Market Mean" serves as a vital support level at approximately $76,600. Further down, a deeper accumulation floor is identified between $62,000 and $65,000, with modeled long-liquidation exposure around $60,000 to $63,000.
These thresholds serve as vital indicators for assessing whether macroeconomic outcomes are introducing genuinely new information into the market. A sustained breach of the $86,000 ceiling would signal that Bitcoin has successfully absorbed a significant volume of overhead supply and pushed major institutional holdings back into profitability. Conversely, a decisive loss of the $76,600 level would suggest a weakening of the support structure underpinning the recent rally. The $62,000 to $65,000 band represents a more profound structural failure point within Glassnode’s analytical framework.

Interestingly, Bitcoin is approaching these resistance levels without the typical on-chain behavior associated with aggressive selling or distribution. Glassnode’s seven-day Sell-Side Risk Ratio has declined significantly from an August peak of 16 basis points to 7 basis points per day. Similarly, the share of realized profit held by long-term holders has fallen from 88% to 47% over the same period. This divergence suggests that while the macroeconomic backdrop may be generating concern, current holder spending patterns do not reflect a commensurate level of urgency to liquidate positions. This indicates that the market is pricing in a baseline scenario for these risks rather than anticipating a severe downturn.
Geopolitical and Commodity Influences: Oil and the Strait of Hormuz
The price of oil, particularly Brent crude, remains a significant factor influencing inflation and global economic sentiment. The commodity’s recent surge above $100 per barrel, coupled with a reported decrease in flows through the Strait of Hormuz to below two million barrels per day, highlights potential supply-side pressures and geopolitical risks. For oil prices to trigger a broad market repricing, conditions would likely need to deteriorate significantly, pushing energy costs substantially beyond current market expectations. A renewed disruption in oil flows, shipping, or infrastructure, especially if coinciding with an upside CPI surprise or hawkish central bank signals, would constitute new information and could dramatically alter the market’s information set.
While less immediate, legislative developments also warrant attention. The U.S. Senate’s scheduled action on September 15th regarding the CLARITY Act, described as cloture on the motion to proceed to H.R. 3633, could potentially alter the policy outlook. However, the article suggests that monetary conditions and macroeconomic data releases are currently considered stronger drivers of Bitcoin’s immediate price action compared to this legislative procedural vote.
Scenario Analysis: Charting Bitcoin’s Potential Paths
The analysis suggests three primary scenarios for Bitcoin’s near-term trajectory, each contingent on the confluence of upcoming macroeconomic events:
1. The Less Restrictive Path: In this optimistic scenario, inflation data cools sufficiently to alleviate pressure on the Federal Reserve. The U.S. central bank either holds interest rates steady or signals a less aggressive pace of future tightening. Concurrently, the Bank of Japan implements only the expected conventional rate hike, and conditions in the Persian Gulf stabilize without new supply shocks. Under this scenario, Bitcoin would first need to overcome the $80,500 corporate treasury break-even level before confronting the significant $83,000 to $86,000 supply band. A sustained move above $86,000 would represent the strongest evidence of a market repricing towards easier financial conditions and successful absorption of overhead supply.
2. The Consensus Path: This scenario envisions CPI figures aligning closely with market expectations. The Federal Reserve and the Bank of Japan broadly adhere to the policy distribution anticipated by traders, and oil prices remain elevated without a new supply shock. In this environment, several significant macroeconomic headlines could emerge without necessarily forcing a new Bitcoin market regime. The cleanest expression of this path would involve Bitcoin continuing to trade within the established range, oscillating between the $76,600 True Market Mean and the $83,000 to $86,000 ceiling.
3. The Downside Path: This scenario unfolds if shocks reinforce one another, creating a negative feedback loop. This could manifest as hotter-than-expected inflation, a more hawkish stance from the Federal Reserve, faster tightening by the Bank of Japan, or a new oil supply disruption. Such a combination could simultaneously drive yields higher, tighten global funding conditions, and diminish risk appetite across asset classes. Bitcoin’s first critical structural test in this scenario would be the $76,600 support level. A failure to hold this level would reintroduce the $62,000 to $65,000 accumulation floor into play.
Bitcoin’s current resilience near the $78,000 mark indicates that the market has thus far absorbed only the baseline expectations for several visible threats. The ultimate direction of Bitcoin’s next significant price movement hinges on whether the unfolding economic outcomes align with these established baselines or represent a decisive break from them, thereby catalyzing a shift in market sentiment and strategy. The coming weeks are therefore critical for understanding the evolving macroeconomic landscape and its profound implications for the future of digital assets.