
 admin
admin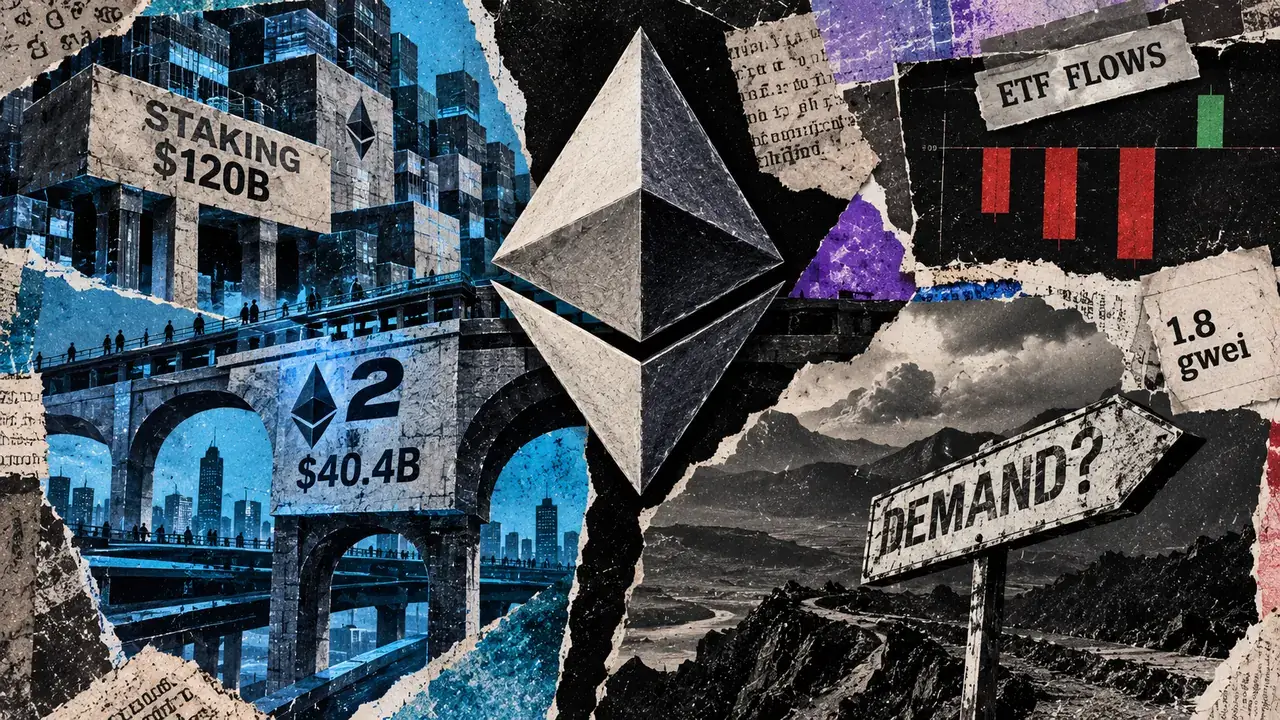
Ethereum’s complex ecosystem, a cornerstone of the decentralized finance (DeFi) world, presented a nuanced picture in late September 2023, with its institutional data hub showcasing substantial figures for staked Ether (ETH) and assets locked on Layer-2 (L2) networks. However, these metrics, while indicative of the network’s robust activity, were juxtaposed against significant net outflows from US-traded Ethereum Exchange Traded Funds (ETFs) and required careful interpretation to avoid misrepresenting fresh demand for the cryptocurrency.
On September 21, 2023, a snapshot from Ethereum’s institutional data hub revealed approximately $120 billion worth of ETH committed to network security through staking. Concurrently, Layer-2 scaling solutions, designed to enhance Ethereum’s transaction throughput and reduce costs, held an average of $40.4 billion in total value locked (TVL) on a daily basis. These two figures, while impressive, represent distinct aspects of the Ethereum economy. Staked ETH signifies capital locked to validate transactions and secure the network, earning rewards in return. The TVL on L2s, conversely, represents the total value of assets deposited and utilized across various decentralized applications and protocols built on these secondary scaling layers.
Experts caution against simply aggregating these numbers to gauge new ETH demand. "Staked ETH represents a commitment to the network’s security, while L2 TVL reflects assets actively engaged within the scaling solutions," explained a blockchain analyst at a prominent digital asset research firm, who preferred to remain anonymous due to the sensitive nature of market analysis. "Adding them together would be like comparing apples and oranges; it doesn’t accurately reflect the inflows into the underlying ETH asset itself."
The distinction is crucial. Staking, a core mechanism for securing Ethereum’s Proof-of-Stake consensus, involves users depositing their ETH to run validator nodes. While this process immobilizes a portion of the ETH supply, it does not inherently signify new capital entering the market. An individual or entity could stake ETH they already held, acquired at any point in the past, without it representing fresh purchasing pressure. The dollar valuation of staked ETH, therefore, is a reflection of both the quantity of ETH committed and its prevailing market price, rather than a direct indicator of recent investment.
This nuance became particularly relevant in the context of outflows from US-traded Ethereum ETFs. Between September 15 and September 18, these investment vehicles experienced net outflows totaling over $140 million. This trend suggests a potential cooling of investor sentiment or a reallocation of capital away from these specific regulated investment products. However, this outflow from ETFs does not necessarily correlate with a decrease in the overall demand for ETH or a reduction in its ecosystem’s activity.
A Staking Balance is Not a Purchase Receipt: Deciphering the Nuances of ETH Commitment
The mechanism of staking on Ethereum, which went live with the Beacon Chain in December 2020, allows ETH holders to participate in network validation by depositing a minimum of 32 ETH. This deposit activates a validator, contributing to the network’s security and earning staking rewards, typically expressed as an annual percentage yield (APY). As of late September 2023, the total amount of ETH staked had steadily grown, reflecting the network’s increasing maturity and the attractiveness of staking rewards.
The concept of "liquid staking" further complicates the interpretation of staked ETH figures. Protocols like Lido, Rocket Pool, and others allow users to stake their ETH while receiving liquid staking tokens (LSTs) in return. These LSTs, such as stETH or rETH, represent the underlying staked ETH and can be traded on secondary markets or used in DeFi protocols, providing holders with liquidity while their ETH remains committed to network validation. While these LSTs offer flexibility, the underlying staked ETH is still locked and unavailable for immediate withdrawal or sale on exchanges. Therefore, the total dollar value of staked ETH, including that represented by LSTs, reflects the total ETH committed to securing the network, not necessarily the ETH acquired with fresh capital.
For investors seeking to understand the true demand for ETH, tracking flows into regulated investment products like ETFs offers a clearer, albeit limited, view of one specific investment channel. The Farside Investors’ Ethereum ETF table provides a historical record of these movements. Looking at the week in question, US-traded spot Ethereum ETFs saw significant fluctuations. On September 14, there were inflows of $121.1 million. However, the subsequent days saw substantial outflows, with $405.4 million bleeding from these funds between September 14 and September 17. The week concluded on September 18 with a rebound, registering $143.7 million in fresh inflows.
These ETF flows, while informative for tracking investment sentiment within these specific products, do not provide a complete picture of total ETH demand. Many investors interact with ETH through direct purchases on exchanges, decentralized platforms, or other indirect means that are not captured by ETF data. "ETF flows are a valuable data point for a particular segment of the market, but they are not the sole determinant of ETH demand," commented a senior analyst at a crypto-focused investment bank. "The broader on-chain activity, developer adoption, and usage of Ethereum-native applications are also critical indicators."
Layer-2 Assets and Ethereum Fees: Distinct Metrics in a Scalable Ecosystem
The $40.4 billion in TVL on Ethereum’s Layer-2 networks represents the aggregated value of assets deployed across these scaling solutions. These L2s, such as Arbitrum, Optimism, Polygon, and zkSync, are designed to process transactions off the main Ethereum chain, thereby reducing congestion and lowering transaction fees for end-users. The assets locked on these L2s are often tokens used within decentralized applications (dApps) for trading, lending, borrowing, and other financial activities.
The connection between L2 activity and ETH holders is primarily through the fees paid by L2 operators to the Ethereum mainnet for data availability and settlement. These fees, often referred to as "gas fees" on Ethereum, are essential for ensuring the security and integrity of transactions processed on L2s. L2BEAT, a prominent analytics platform for L2 solutions, tracks these on-chain costs, which include expenses for calldata, blobs, compute, and overhead.
It is crucial to understand that the fees users pay directly to an L2 protocol may differ from the costs incurred by L2 operators to settle transactions on the Ethereum mainnet. Furthermore, the spending on L2 data blobs, a feature introduced with Ethereum’s Dencun upgrade (EIP-4844), is a significant component of the settlement bill but does not encompass the entire cost.
The concept of "ETH burned" is also directly linked to transaction fees. The execution base fee of transactions on Ethereum is burned, effectively removing ETH from circulation. Priority fees, on the other hand, are directed to validators as compensation. Blob fees, associated with EIP-4844, operate in a separate market and are also burned. This burn mechanism contributes to Ethereum’s deflationary or disinflationary potential, depending on the rate of ETH issuance.
The distinction between L2 activity, mainnet settlement costs, and ETH burn is vital for accurate analysis. A rise in L2 activity does not automatically translate into a proportional increase in demand for ETH from every ETH holder. Instead, it signifies increased usage of the Ethereum ecosystem, which indirectly benefits ETH through fee burn mechanisms. The total amount of ETH burned is a function of the gas consumed and the applicable execution and blob fees. Net supply change is also influenced by the rate at which new ETH is issued through staking rewards.
As of September 21, 2023, the average gas price on Ethereum’s mainnet, as displayed on platforms like Ultrasound.money, was around 1.8 gwei. Lower execution base fees generally indicate reduced network congestion and potentially more efficient scaling solutions, leading to less ETH burned per unit of gas consumed, all other factors being equal. However, total ETH burn is ultimately determined by the volume of transactions and the prevailing fee rates.
Broader Implications and Future Outlook
The metrics from Ethereum’s institutional data hub highlight the network’s dual role. Staking positions ETH as a critical component for network security and validator rewards, fostering a long-term commitment from holders. Simultaneously, its role in settlement and fee payments for L2 solutions solidifies its utility as the economic backbone of a burgeoning decentralized economy.
The interplay between these functions and ETH acquisition is complex. Whether increased staking participation and L2 activity translate into sustained additional ETH purchases or a consistent reduction in circulating supply hinges on a confluence of factors, including market sentiment, regulatory developments, technological advancements, and the overall adoption rate of decentralized applications.
The $120 billion in staked ETH represents a significant portion of the circulating supply, demonstrating a strong belief in Ethereum’s long-term value proposition and its security model. Similarly, the $40.4 billion locked on L2s underscores the growing utility and adoption of Ethereum’s scaling solutions, hinting at future demand for the base layer’s settlement capabilities.
However, the recent outflows from Ethereum ETFs serve as a reminder that the digital asset market remains susceptible to macroeconomic factors, shifts in investor risk appetite, and speculative pressures. While institutional interest in Ethereum remains robust, as evidenced by the substantial staking figures, short-term investment trends can diverge from long-term fundamental growth.
The ongoing development of Ethereum, particularly with upcoming upgrades aimed at further enhancing scalability and efficiency, will continue to shape these metrics. The success of Layer-2 solutions in attracting users and capital, coupled with the evolving dynamics of ETH issuance and fee burn, will determine the net impact on ETH’s supply and demand over time. The figures from September 2023 provide a snapshot of a dynamic ecosystem, where underlying network strength and user activity coexist with the ebb and flow of investment through various channels. Understanding these distinct metrics is paramount for any observer seeking to grasp the true health and trajectory of the Ethereum network.