
The cryptocurrency market is currently navigating a period of heightened uncertainty as key on-chain metrics reveal a notable divergence in behavior between large-scale Bitcoin holders, often referred to as "whales," and smaller retail investors. According to analysis from crypto sentiment platform Santiment, while retail investors have shown an inclination to purchase Bitcoin (BTC) as its price dipped below the crucial $70,000 mark, whale activity suggests that the leading digital asset could experience further price depreciation if historical patterns hold true. This cautionary signal comes at a time when Bitcoin’s rally from its October all-time high of $126,000 has been punctuated by significant volatility, leaving investors on edge regarding its immediate trajectory.
The Whales and the Retail Horde: A Market Tug-of-War
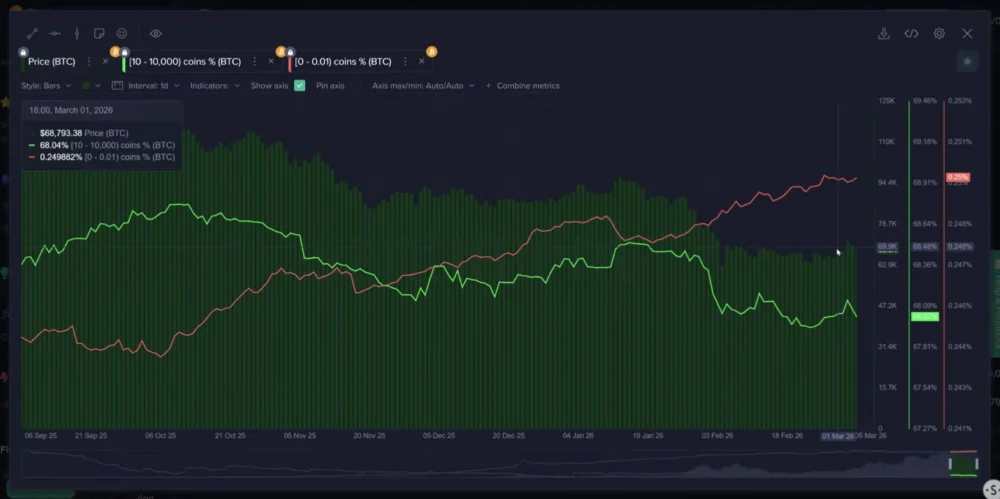
Santiment’s recent report, issued on Friday, highlighted a critical shift in market dynamics. "The moment Bitcoin hit $74k, these key stakeholders began taking profit," the platform stated, referring to the cohort of Bitcoin whales. In the lexicon of cryptocurrency analytics, "whales" are typically defined as entities holding substantial amounts of a particular digital asset, often enough to significantly influence market prices through their buying and selling activities. Santiment specifically categorizes whales as addresses holding between 10 and 10,000 Bitcoin. Conversely, "retail investors" are typically smaller participants, in this context defined as those holding less than 0.01 Bitcoin, whose collective actions can also indicate broader market sentiment but whose individual trades have less impact.
The observed pattern indicates a classic distribution phase, where larger, often more sophisticated, investors capitalize on price peaks by selling, while smaller, sometimes less experienced, investors step in to "buy the dip," often driven by fear of missing out (FOMO) or a belief that the correction is temporary. Historically, such a divergence has often preceded further downward price movements, as the selling pressure from large holders can overwhelm retail demand.
A Detailed Chronology of Recent Market Movements
The period between late February and early March 2026 provides a clear illustration of this phenomenon. Santiment’s data shows that Bitcoin whales engaged in "heavy accumulation" during the ten-day window from February 23 to March 3. During this time, Bitcoin’s price was trading within a range of approximately $62,900 to $69,600. This accumulation phase suggested confidence among large holders that the price was undervalued or poised for a rebound following a dip from its October 2025 peak of $126,000, and a subsequent fall to $60,000 on February 6, 2026.
Following this accumulation, Bitcoin indeed experienced a notable rebound. Beginning on Wednesday, March 5, the cryptocurrency surged past the psychologically important $70,000 threshold, briefly touching $74,000. This upward movement appears to have been the trigger for the whales’ profit-taking strategy. Santiment’s analysis reveals that this cohort offloaded approximately 66% of the Bitcoin they had purchased during their prior accumulation phase. This rapid divestment suggests a calculated move to secure gains at what they perceived to be a local peak.
Concurrently, as whales were selling into strength, retail investors were observed to be increasing their positions. This behavior is typical of market corrections, where smaller investors, often influenced by media narratives or a belief in Bitcoin’s long-term potential, view price dips as opportune entry points. While their collective buying can provide some temporary support, it often struggles to counteract sustained selling pressure from larger entities.
Decoding Market Sentiment: The Crypto Fear & Greed Index
The broader market sentiment has also reflected this cautious outlook. The Crypto Fear & Greed Index, a widely referenced metric that gauges market emotion, experienced a significant drop of 6 points. This decline pushed the index further into "Extreme Fear" territory, registering a score of 12 on Saturday. The index, which ranges from 0 (Extreme Fear) to 100 (Extreme Greed), aggregates data from various sources including volatility, market momentum, social media sentiment, surveys, and Bitcoin dominance to provide a holistic view of investor emotion.
"Extreme Fear" typically indicates that investors are overly concerned and potentially overselling, which, paradoxically, has historically been a signal of potential buying opportunities for contrarian investors. However, when combined with whale distribution, it reinforces the narrative of a market in flux, where current fear might not yet have reached its nadir. The current reading of 12 is significantly lower than previous periods of market exuberance, suggesting a profound shift in investor confidence following the recent price correction from its all-time high.
Institutional Flows Signal Caution: Spot Bitcoin ETFs

Further compounding the bearish sentiment is the performance of US-based spot Bitcoin Exchange-Traded Funds (ETFs). These investment vehicles, which allow traditional investors to gain exposure to Bitcoin without directly holding the asset, have become a significant factor in market dynamics since their approval. On Friday, March 7, these 11 ETF products collectively experienced their largest outflow day in three weeks, with a total net outflow of $348.9 million, according to data from Farside.
The previous significant outflow event occurred on February 12, marking a period of heightened selling pressure from institutional investors. Large outflows from ETFs typically indicate that institutional money is moving out of Bitcoin, either to take profits, rebalance portfolios, or in anticipation of further price declines. Given that these ETFs have attracted billions in capital since their inception, their flow patterns are closely watched as a proxy for institutional sentiment. A sustained period of net outflows could exacerbate selling pressure and contribute to a deeper market correction. The magnitude of this latest outflow suggests a considerable shift in institutional appetite for Bitcoin in the short term, moving from accumulation to divestment.
Expert Perspectives on Bitcoin’s Trajectory
Market analysts and economists are offering varied, though generally cautious, outlooks on Bitcoin’s immediate future. Michael van de Poppe, founder of MN Trading Capital, shared a perspective mirroring Santiment’s concerns. In an X (formerly Twitter) post on Friday, van de Poppe stated, "If Bitcoin doesn’t find support in this $67-68K region, then we’re likely going to retest the lows for liquidity before bouncing back upwards." This technical analysis suggests that the current trading range is critical. A failure to hold the $67,000-$68,000 support level could trigger a move towards lower price points, potentially revisiting the $60,000 level seen in early February, as the market seeks "liquidity" – essentially, a price level where sufficient buying interest emerges to absorb selling pressure and establish a new floor.
Conversely, economist Timothy Peterson presented a more optimistic long-term view, suggesting a robust floor for Bitcoin’s price. Peterson, known for his application of Metcalfe’s Law to Bitcoin valuation, asserted, "This valuation level has always marked a bottom for Bitcoin. About 99.5% chance it stays above $60k." He referred to the Bitcoin Price to Metcalfe Value chart, a model that assesses Bitcoin’s intrinsic value based on its network effects, arguing that the $60,000 mark represents a historically strong support derived from fundamental network growth. Metcalfe’s Law posits that the value of a telecommunications network is proportional to the square of the number of connected users of the system (n^2). Applied to Bitcoin, it suggests that the network’s value grows exponentially with its user base, providing a fundamental underpinning for its price. Peterson’s analysis, therefore, suggests that while short-term volatility is expected, the underlying network strength provides a formidable floor against drastic price collapses, especially in the context of a previous all-time high of $126,000.
Historical Precedents and Market Cycles
The current market behavior, characterized by a significant rally followed by a correction and divergent investor actions, is not unprecedented in Bitcoin’s history. Bitcoin markets have consistently exhibited cyclical patterns, often referred to as "halving cycles," which traditionally involve a parabolic bull run, followed by a substantial correction, and then a period of accumulation before the next major surge. While the original article is set in March 2026, implying that any recent halving would have already occurred (likely in early 2024), the market’s current phase might represent a mid-cycle correction after a post-halving rally that saw it reach $126,000.
Such corrections are a natural and often healthy part of bull markets, serving to "shake out" overleveraged positions and re-establish a more sustainable growth trajectory. The debate over the exact nature of Bitcoin’s four-year cycle, as highlighted by Benjamin Cowen, centers on whether these historical patterns will continue to hold true in an increasingly institutionalized market. However, the current indicators suggest that market psychology and the interplay between different investor cohorts remain potent forces, even as the market matures.
The Road Ahead: Navigating Volatility
The immediate future for Bitcoin appears to be one of continued volatility, with the potential for further downward pressure before a definitive rebound. The divergence between whale and retail behavior, coupled with negative institutional flows from ETFs and extreme fear in the market, points towards a period where caution is warranted. Investors are advised to monitor key support levels, particularly the $67,000-$68,000 region, as well as the $60,000 floor identified by Timothy Peterson’s valuation model.
While short-term predictions remain uncertain, the long-term outlook for Bitcoin continues to be underpinned by its fundamental technology, increasing adoption, and its role as a hedge against inflation and traditional financial instability. The current correction, while painful for some, could ultimately serve as a necessary recalibration before Bitcoin potentially resumes its upward trajectory towards new highs beyond the $126,000 mark achieved in October 2025. The evolving market structure, with the increasing influence of institutional players and regulated products like spot ETFs, adds new layers of complexity to these cycles, demanding a more nuanced understanding of market dynamics. As the market digests these developments, resilience and a long-term perspective will likely be key for navigating the turbulent waters ahead.
Cointelegraph is committed to independent, transparent journalism. This news article is produced in accordance with Cointelegraph’s Editorial Policy and aims to provide accurate and timely information. Readers are encouraged to verify information independently. Read our Editorial Policy https://cointelegraph.com/editorial-policy