
 admin
admin
Intensified activity across Bitcoin’s (BTC) futures markets has emerged as the principal driver of its short-term price movements, consistently drawing the asset toward zones where significant leveraged positions are clustered. In financial markets, prices frequently gravitate toward areas of concentrated liquidity, and as Bitcoin endeavors to maintain its position above the critical $64,000 threshold, a detailed examination of current liquidation scenarios offers crucial insights into its probable trajectory. This dynamic interplay between price and leveraged positions underscores the growing influence of derivatives in shaping the cryptocurrency’s immediate future.
The Influence of Liquidation Heatmaps on Price Discovery
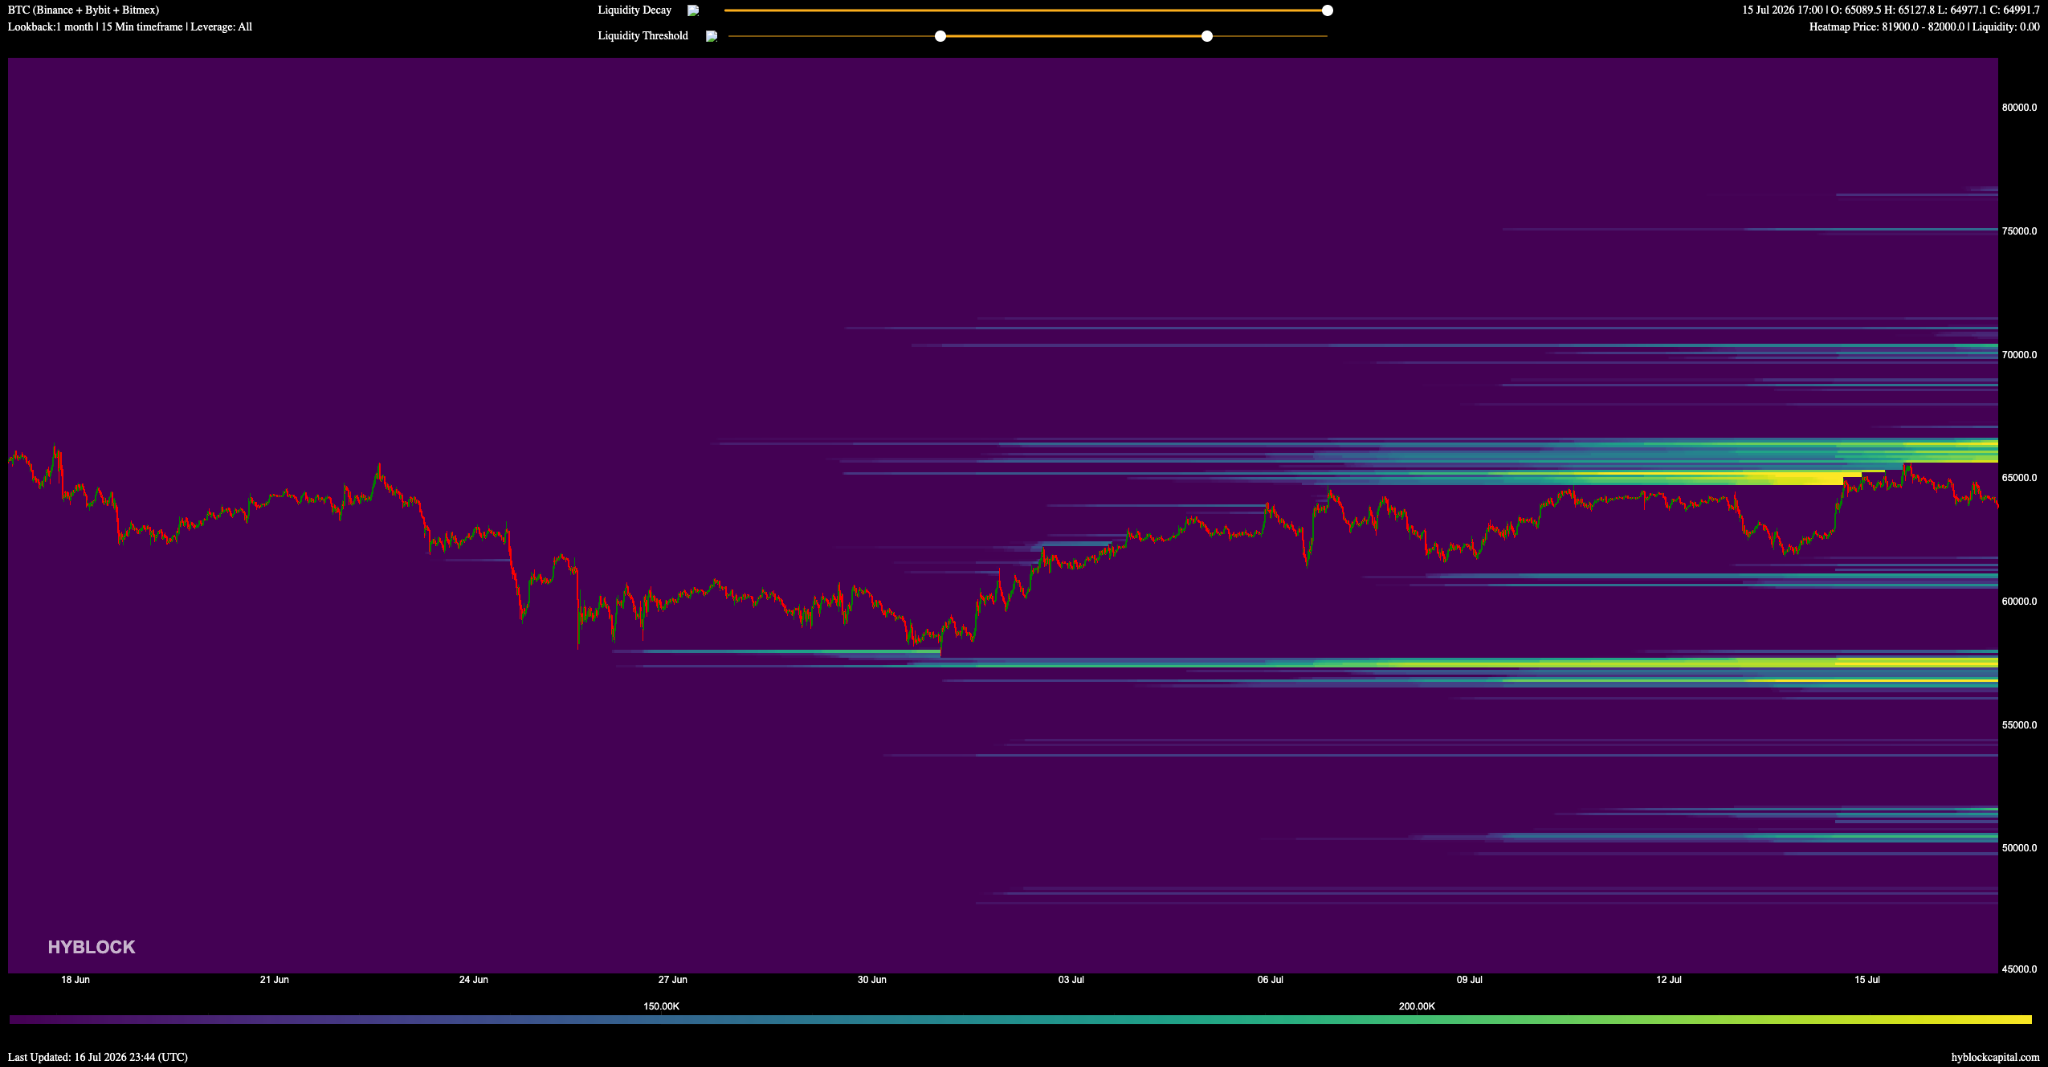
Liquidation heatmaps, sophisticated analytical tools that visualize potential liquidation levels across various exchanges, currently indicate a notable concentration of short positions positioned between $65,500 and $66,000. This cluster is approximately 3% above the prevailing market price. Should Bitcoin’s price exhibit sufficient momentum to breach the $65,600 level, it could activate these short positions, triggering a cascade of liquidations. Such an event, often referred to as a "short squeeze," has the potential to accelerate a more substantial upward rally, potentially propelling BTC towards the $67,000 mark. These heatmaps serve as predictive indicators, highlighting where market participants, particularly those employing leverage, stand to incur significant losses or gains, thereby creating magnetic price zones.
Conversely, below the current market pricing, robust support layers are identified within the $63,500 to $63,750 range, representing the closest cluster of buying interest, roughly 1% below the current price. Further down, more substantial liquidity pools are observed at $63,000-$63,250, approximately 1.5% lower, and at $62,500-$62,750, about 2.3% below the present valuation. These levels represent areas where a significant volume of long positions would face liquidation, or where substantial buy orders are likely placed, acting as potential price floors. The existence of these defined support and resistance zones, illuminated by liquidation data, paints a clear picture of the immediate battleground for Bitcoin’s price.
The Role of Leveraged Positions and Market Imbalance
A comprehensive analysis of the tracked window reveals that long-side liquidity significantly outweighs short-side liquidity, almost by a two-to-one ratio. This imbalance carries substantial implications, potentially signaling that a considerable portion of the leverage built up over the past month has yet to be fully closed out or unwound. Such an environment, characterized by a predominance of leveraged long positions, introduces a heightened degree of market fragility. While a surge in price could lead to a rapid short squeeze, a downturn could trigger a more extensive liquidation cascade among long holders, amplifying downward pressure. This condition suggests a market teetering on a knife-edge, highly susceptible to volatility induced by significant price movements in either direction.
Understanding leverage is crucial here. In futures trading, leverage allows traders to control a larger position with a smaller amount of capital. While this can amplify gains, it also magnifies losses, leading to forced liquidations when the market moves against a leveraged position. The concentration of long-side leverage means that many traders are betting on higher prices, but if Bitcoin drops, these positions will be automatically closed out by exchanges to prevent further losses, selling off assets and adding to downward momentum.
Broader Market Context: Open Interest and Funding Rates
The current market dynamics are further elucidated by examining Bitcoin’s aggregate open interest (OI) and funding rates. Open interest refers to the total number of outstanding derivatives contracts, such as futures or options, that have not been settled. It provides a measure of market activity and liquidity in the derivatives market. A high OI typically indicates strong market participation and potentially increased volatility.

In the preceding week, open interest witnessed a reduction of over 3% from its peak observed on Tuesday. Remarkably, this decrease in OI occurred with minimal corresponding movement in BTC’s spot price. Simultaneously, funding rates—periodic payments exchanged between long and short positions in perpetual futures contracts to keep the contract price close to the spot price—have cooled, trending towards a more neutral stance. When funding rates are positive, long position holders pay short position holders, indicating bullish sentiment. Conversely, negative funding rates suggest bearish sentiment. The shift towards neutral funding, combined with the slight dip in OI without a significant price change, suggests a recalibration of market sentiment, potentially reducing some of the immediate overheating concerns.
This moderation in derivatives metrics has coincided with a notable trend in underlying market flows. Over the past week, both spot and futures flows have predominantly favored the buy side, indicating a sustained, albeit perhaps cautious, accumulation interest from market participants. This divergence—cooling leverage metrics alongside continued buying interest—suggests a complex market environment where underlying demand persists even as speculative excesses in derivatives markets are being gradually reined in.
The Bearish Scenario: A Deep Liquidation Band at $55,000
While the immediate focus remains on the $60,000-$67,000 range, a more profound bearish scenario looms. A wide liquidation band near $55,000 has accumulated over the full month lookback period. This level stands out as a significant "liquidity magnet," representing a substantial cluster of leveraged long positions that would face liquidation if the price were to fall to this level. The sheer size of this band suggests that a break below the identified support levels in the $62,500 to $63,750 range could trigger a substantial downward movement. Such a cascade could rapidly accelerate, pulling the price toward $55,000 as forced selling from liquidated positions adds significant sell pressure to the market. This scenario highlights the inherent risks of a market heavily reliant on leverage and the potential for rapid, significant price corrections.
Historically, Bitcoin has demonstrated a propensity for sharp movements when key support or resistance levels tied to large liquidation zones are breached. The psychological impact of breaking through widely observed thresholds can also exacerbate these movements, prompting both retail and institutional traders to adjust their positions defensively.
Recent Market Chronology and Range-Bound Projections
The price action observed over the last few weeks strongly suggests that Bitcoin may remain range-bound, oscillating between the $60,000 and $67,000 marks. This assessment is further reinforced by the aggregate open interest and funding rate data. Following a period of significant volatility earlier in the year, partly fueled by the launch of spot Bitcoin Exchange-Traded Funds (ETFs) in the United States and the Bitcoin halving event in April, the market appears to have entered a phase of consolidation.
The post-halving environment often sees a period of sideways trading as the market digests the supply shock and new demand dynamics. The institutional interest brought by the ETFs has introduced a new class of investors, potentially leading to more structured and less volatile price discovery over the long term, though short-term derivatives activity continues to exert considerable influence.
Over the past month, Bitcoin’s price has largely maintained this range, with attempts to break higher often met with resistance, and dips finding support. This pattern is indicative of a market searching for equilibrium, where neither bulls nor bears have been able to establish decisive control for an extended period. The cooling of funding rates towards neutral, despite sustained buy-side activity, further supports the idea of a market consolidating rather than preparing for an immediate, explosive breakout or breakdown. This period of consolidation allows for the unwinding of excessive leverage and the accumulation of new positions, setting the stage for future price discovery.
Implications for Traders and Investors
For short-term traders, the identified liquidation zones serve as critical points of interest. A break above $65,600 could signal a bullish opportunity to ride a short squeeze towards $67,000. Conversely, a failure to hold support at $63,500, particularly if followed by a breach of $62,500, could open the door for a more significant retracement, potentially targeting the $55,000 area. Understanding these levels allows traders to set more informed stop-loss orders and profit targets, managing risk more effectively in a volatile market.
For long-term investors, the current consolidation phase, characterized by a reduction in some speculative excesses (as seen in cooling funding rates), might be viewed as a healthy development. It could represent a period of accumulation before the next leg of a bull market. However, the large liquidation band at $55,000 serves as a stark reminder of potential downside risks, emphasizing the importance of prudent position sizing and risk management, even for those with a longer time horizon.
Market observers and analysts frequently highlight that the increased sophistication of derivatives markets, while offering opportunities for hedging and speculation, also introduces complex feedback loops. These loops can amplify price movements, making it imperative for participants to employ advanced analytical tools like liquidation heatmaps to navigate the landscape effectively. The interplay between spot market demand, institutional flows, and the intricate mechanics of leveraged futures markets will continue to define Bitcoin’s price action in the foreseeable future.
Conclusion
The current state of Bitcoin’s market is unequivocally dominated by the dynamics of its futures markets, with liquidation levels acting as powerful magnets for price action. As Bitcoin grapples with maintaining its stance above $64,000, the immediate future appears to be a tug-of-war between bullish aspirations aiming for $67,000 via a short squeeze, and bearish pressures that could see a retreat towards the significant $55,000 liquidation zone. The observed imbalance in leveraged positions, with long-side liquidity significantly outweighing short-side, coupled with the nuanced signals from open interest and funding rates, points to a market in a delicate state of equilibrium. Navigating this environment requires a keen understanding of these derivatives-driven mechanics, as they will undoubtedly continue to dictate Bitcoin’s trajectory in the coming days and weeks.
This article is produced in accordance with Cointelegraph’s Editorial Policy and is intended for informational purposes only. It does not constitute investment advice or recommendations. All investments and trades carry risk; readers are encouraged to conduct independent research.