
Bitcoin (BTC) is exhibiting strong bullish momentum, with market analysts and technical indicators suggesting a potential surge towards the $80,000 mark in March. This renewed optimism follows a significant price rebound that has invalidated previously bearish chart patterns and ignited confidence among investors and traders. At least three key indicators are flashing increasing upside momentum, painting a robust picture for the cryptocurrency’s near-term trajectory.
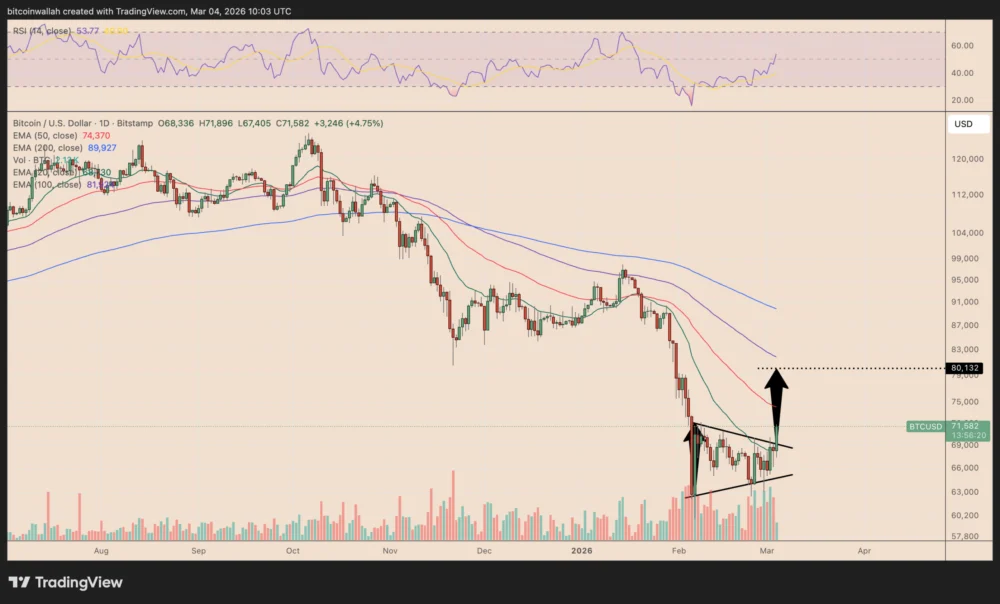
The recent price action for BTC has been characterized by a pivotal technical shift. On Wednesday, the BTC/USD pair successfully invalidated what initially appeared to be a bear pennant formation, a pattern typically associated with further downside. This reversal occurred as Bitcoin’s price pierced the upper trend line of the pennant, experiencing a notable jump of 5.21% to approximately $71,900. Crucially, this breakout was accompanied by a significant rise in trading volume, lending credibility and strength to the rally. Increased volume during a breakout suggests that a substantial number of market participants are actively buying, indicating strong conviction behind the upward movement rather than a mere short squeeze or low-volume fluctuation.
The invalidation of the bear pennant has simultaneously increased the odds of a symmetrical triangle bullish reversal pattern coming into play. A symmetrical triangle is a well-known chart pattern in technical analysis that forms when an asset’s price creates a series of lower highs and higher lows, effectively compressing into a tightening range. This pattern signifies a period of consolidation where neither buyers nor sellers are dominant, leading to decreased volatility as the price converges. It is typically considered a continuation pattern, but in this context, it suggests a potential reversal from the previous trend. The pattern resolves when the price breaks decisively above or below one of the converging trendlines, with the subsequent move often being as significant as the pattern’s maximum height, or its widest range.

In Bitcoin’s current scenario, the symmetrical triangle’s widest range is estimated to be between roughly $63,000 and $71,000-$72,000. Applying a standard measured move above the upper trend line of this developing symmetrical triangle projects a target of approximately $80,000 in March, provided the breakout sustains itself. This critical price level is not merely an arbitrary target; it aligns closely with Bitcoin’s 100-day exponential moving average (100-day EMA), which often acts as a significant dynamic resistance or support level. The 100-day EMA is a widely watched indicator that provides a smoothed average of the price over the past 100 trading days, offering insights into the longer-term trend.
However, the path to $80,000 is not without immediate challenges. Bitcoin’s next significant hurdle lies at the 50-day EMA, currently positioned near $74,400. The 50-day EMA is another crucial short-to-medium-term indicator that traders closely monitor. A strong rejection at this level could weaken the current breakout and potentially trigger a pullback towards the 20-day EMA, which currently hovers around $68,700. The 20-day EMA serves as a more immediate indicator of short-term trend and support. A successful breach of the 50-day EMA, especially with sustained volume, would further bolster the bullish argument and clear a path for testing higher resistance levels.
Beyond technical chart patterns, another compelling indicator supporting the $80,000 target is the presence of an unfilled CME futures gap. This gap, a common phenomenon in the Bitcoin futures market on the Chicago Mercantile Exchange (CME), arises because CME Bitcoin futures trading pauses over the weekend. If Bitcoin’s spot price experiences significant movement while the futures market is closed, the futures contract will reopen at a new level on Monday morning, leaving an "empty" price zone, or gap, on the futures chart. These gaps often act as price magnets, with a historical tendency to be filled as spot and futures prices eventually realign.
As of Wednesday, a significant CME gap has been observed in the range of $79,660 to $81,210, remaining unfilled since early February. This specific gap directly overlaps with the $80,000 measured target derived from the symmetrical triangle pattern, thereby transforming the area into a powerful "magnet zone" for bullish traders. The historical precedent for CME gaps being filled is noteworthy; nine out of the last ten CME gaps have been closed since August 2025. This strong statistical tendency provides a significant degree of confidence to traders who view the $79,660–$81,210 region as a high-priority target for price convergence. The confluence of a technical pattern target and a historically reliable futures market anomaly strengthens the case for a move to $80,000, suggesting that both fundamental and derivative market forces are aligning towards this valuation.

Further amplifying the bullish sentiment, data from Polymarket, a prominent crypto-based prediction market, indicates a clear shift in expectations for Bitcoin’s performance in March. Polymarket allows users to trade contracts based on real-world outcomes, effectively providing a decentralized and real-time gauge of collective market sentiment. Traders on Polymarket are now assigning a 40% probability that Bitcoin will reach $80,000 by the end of March, a substantial increase from just 20% a day prior. The conviction for the $75,000 target is even stronger, with 70% odds, up from 40% the previous day. This rapid increase in perceived probability for higher price targets reflects a palpable change in market psychology, where participants are increasingly betting on upward movement. Concurrently, the odds of BTC’s price reaching lower targets, such as $65,000 and $60,000, have decreased, suggesting that the collective crowd is actively trimming their downside expectations and bracing for further appreciation. Prediction markets, while not infallible, offer a unique insight into aggregated market sentiment and often reflect underlying trends before they fully manifest in spot prices.
Broader Market Context and Influencing Factors
The current bullish outlook for Bitcoin is not an isolated phenomenon but rather part of a larger narrative driven by several significant market developments. Bitcoin recently achieved new all-time highs, surpassing its previous peak set in 2021, a testament to its enduring strength and renewed investor confidence. This achievement, coming even before the highly anticipated halving event, underscores the unique market dynamics currently at play.
A major catalyst has been the approval and subsequent performance of spot Bitcoin Exchange-Traded Funds (ETFs) in the United States. These ETFs, particularly those from major financial institutions like BlackRock (IBIT), have seen consistent and substantial inflows of capital. For instance, recent reports indicated that US spot Bitcoin ETFs collectively added $225 million in a single day, with BlackRock’s IBIT playing a crucial role in offsetting redemptions from other funds. These inflows represent a significant new avenue for institutional and traditional retail investors to gain exposure to Bitcoin without directly holding the asset, providing a steady stream of demand that was previously unavailable. The sustained institutional interest is a powerful demand-side driver, contributing to Bitcoin’s price stability and upward trajectory.

Looking ahead, the upcoming Bitcoin halving event, typically occurring every four years, is another critical factor. The halving reduces the supply of new Bitcoin entering the market by cutting the reward for mining new blocks by half. Historically, every halving event has been followed by a significant bull run, as the reduction in supply meets sustained or increasing demand, leading to price appreciation. While the exact impact and timing are subject to market conditions, the anticipation of the halving often creates a self-fulfilling prophecy, with investors accumulating Bitcoin in the months leading up to the event. This confluence of new institutional demand and tightening supply dynamics forms a potent bullish cocktail for Bitcoin’s long-term prospects.
Furthermore, the macroeconomic environment, while complex, also plays a role. While central banks grapple with inflation and interest rate policies, Bitcoin’s narrative as a "digital gold" or a hedge against traditional financial system uncertainties continues to resonate with a segment of investors. As global economic landscapes shift, assets perceived as scarce and decentralized often gain traction.
Potential Hurdles and Cautions
Despite the overwhelmingly bullish signals, it is imperative for investors to maintain a balanced perspective and acknowledge the inherent volatility of the cryptocurrency market. While technical analysis provides valuable insights, it is not foolproof, and market conditions can change rapidly. The resistance levels identified, particularly the 50-day EMA near $74,400, represent significant psychological and technical barriers. A failure to break convincingly above this level could trigger profit-taking and a temporary pullback, as traders might view it as an opportune moment to secure gains.

Moreover, the cryptocurrency market is susceptible to various external factors, including regulatory news, macroeconomic shifts, and unforeseen geopolitical events. While institutional adoption is growing, the market remains relatively nascent compared to traditional finance, and sudden large-scale sell-offs from major holders or unexpected market-moving news can lead to rapid price corrections.
As with any investment, readers are strongly advised to conduct their own thorough research and exercise caution. The information presented here does not constitute investment advice or recommendations. Every investment and trading decision involves inherent risks, and past performance is not indicative of future results. While efforts are made to provide accurate and timely information, the dynamic nature of financial markets means that no entity can guarantee the absolute accuracy, completeness, or reliability of any information. Forward-looking statements, while based on current data and trends, are subject to significant risks and uncertainties.
A Pivotal Moment for Bitcoin
In conclusion, Bitcoin stands at a pivotal juncture, with a convergence of strong technical indicators, historical market tendencies, and shifting sentiment pointing towards a potential retest of, or even a breakthrough past, the $80,000 psychological barrier in March. The invalidation of bearish chart patterns, the magnetic pull of an unfilled CME futures gap, and the increasingly bullish outlook from prediction markets collectively build a compelling case for further upside. Coupled with the consistent institutional demand fueled by spot ETFs and the impending halving event, the overall market environment appears robust for Bitcoin’s continued ascent. While vigilance and due diligence remain paramount in the volatile crypto landscape, the confluence of these factors positions Bitcoin for an exciting period of price discovery and reinforces its growing stature in the global financial arena.