
Bitcoin’s (BTC) market structure has definitively shifted into a corrective phase, a development observed since late January following the loss of a critical onchain valuation level. This period is characterized by a compression of BTC’s price within a demand zone established earlier in 2024, concurrent with a noticeable softening of liquidity conditions across the market. Delving deeper into the underlying mechanics, data from leading onchain analytics platforms like Glassnode and CryptoQuant reveals a significant trend: Bitcoin supply is steadily migrating into long-term, retail-linked wallets, while overall exchange activity has cooled considerably. This confluence of technical indicators, onchain data, and a discernible capital rotation pattern is poised to exert considerable influence on Bitcoin’s immediate and future price trajectory, shaping the narrative for the coming months.
The onset of this corrective phase was marked by Bitcoin’s inability to sustain its position above its "true market mean," a crucial onchain valuation metric identified by Glassnode. This level, approximated near $79,000, represents the aggregated cost basis of the tracked active supply and serves as a significant psychological and technical benchmark for market participants. Its breach in January served as a catalyst, accelerating the recent price dip and signaling a retreat from the euphoric highs observed in late 2023 and early 2024. This move below the active supply cost price indicated that a substantial portion of recently active coins were now held at a loss, or at least at a reduced profit margin, prompting a re-evaluation of market sentiment and positioning.
The Resilience of the $60,000-$69,000 Demand Zone
Following the initial downturn, Bitcoin’s price found a degree of stabilization within a dense trading range spanning $60,000 to $69,000. This particular zone has proven to be a robust support level, largely due to the determined defense mounted by medium-term holders. The strength of this demand zone is not merely coincidental; it is underpinned by the age of coins accumulated within this price band for the majority of 2024. As Glassnode’s "The Week On-chain" report elaborated, a significant cohort of coins acquired in this range has now aged beyond a year, meaning these holders have weathered market fluctuations and are now approaching their breakeven point or are holding at a modest profit. This maturation of supply within the $60,000-$69,000 range has effectively tempered further selling pressure, as these holders are less likely to capitulate and are instead showing a preference for holding their positions.
Market analyst Ardi echoed this sentiment, highlighting the historical significance of this range. On the social media platform X, Ardi pointed out, "We’re trading inside the same $53-73K range that took 245 days to build last year. Think about how much volume went through this zone. This is the most contested zone on BTC’s entire chart right now." This historical context underscores the fundamental importance of this price area, suggesting that the current consolidation is occurring within a well-established and heavily transacted liquidity pocket. The prolonged accumulation and distribution that occurred in this range during previous periods mean that many participants have deeply entrenched cost bases here, creating strong gravitational pull and resistance to rapid movements outside these bounds.

Understanding Liquidity and Deeper Support Levels
While the $60,000-$69,000 range has held firm, Glassnode’s analysis also introduces a crucial perspective on potential deeper support levels by referencing the "realized price." This metric, which estimates the average acquisition cost of all circulating coins, currently stands near $54,900. In past market cycles, particularly during more pronounced bear phases, Bitcoin’s price has often gravitated toward or tested the realized price as a fundamental floor. This suggests that while the current demand zone is strong, a sustained breakdown could potentially see a retest of this lower, historically significant valuation level. Such a scenario, while not immediately imminent, remains a possibility that market participants monitor closely, especially if broader macroeconomic conditions or unforeseen catalysts were to emerge.
Further insights into market dynamics come from Bitcoin’s liquidity conditions, which have remained compressed. The 90-day realized profit/loss ratio has notably declined, moving back into the 1–2 range. This particular range is historically associated with limited capital rotation, indicating that less profit-taking and fresh capital injection are occurring. A sustained move below 1 in this ratio has consistently aligned with stressed bear environments, where market participants are predominantly realizing losses rather than profits, leading to further price depreciation. The current position, while not yet in a "stressed bear" territory, suggests a cautious and less dynamic market, where traders are less inclined to take significant risks, contributing to the overall cooling of exchange activity. This subdued capital rotation often precedes periods of accumulation or a prolonged sideways movement as the market seeks a new equilibrium.
The Inexorable Rise of BTC Accumulation
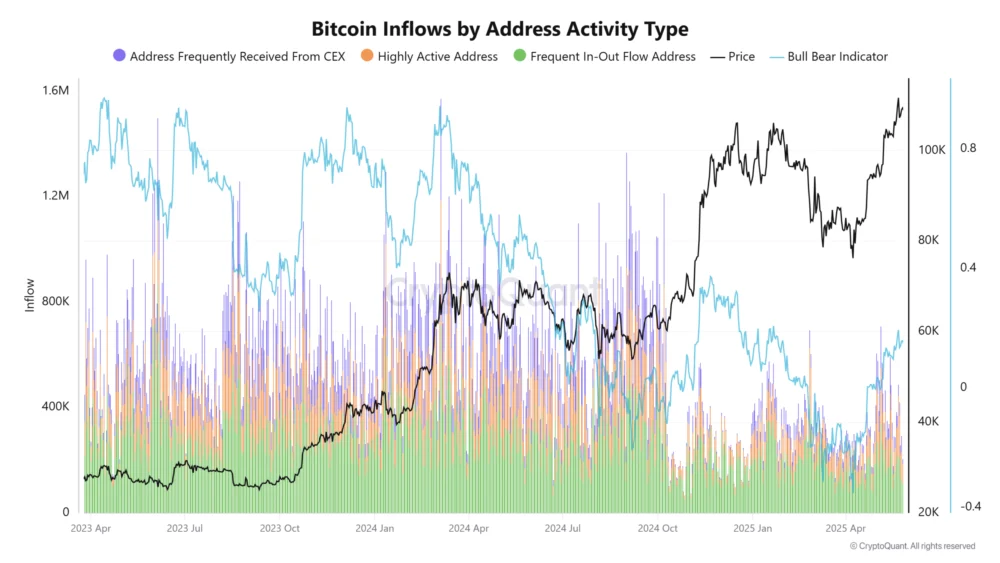
Despite the recent price volatility and the overall cooling of market activity, a compelling counter-trend has been identified by CryptoQuant: a steady and significant rise in Bitcoin accumulation. Data from CryptoQuant reveals that balances held by accumulating address cohorts have continued their upward trajectory into early 2026. The total BTC held by these cohorts has expanded dramatically, increasing from approximately 2 million BTC in early 2024 to over 4 million BTC currently. This robust expansion reflects a persistent and strong absorption of supply, particularly from long-term oriented investors.
A granular look at these accumulating cohorts further highlights the nature of this absorption. Retail-linked accumulation addresses have notably increased their holdings by an impressive 850,000 BTC. These are typically smaller wallets associated with individual investors rather than large institutions or whales. Parallel to this, "accumulating pattern wallets"—addresses that consistently add BTC at recurring intervals with minimal outflows—have expanded their holdings to 1.27 million BTC. Crucially, this significant expansion in holdings by both retail and consistent accumulators has occurred even amidst the price drops observed in 2026, demonstrating conviction from these market segments. This pattern suggests that these holders view current price levels as attractive entry or accumulation points, signaling long-term bullish sentiment despite short-term price corrections.

In stark contrast to this rising accumulation, inflows from centralized exchange addresses and highly active trading addresses have moderated considerably. Compared to the expansion phases witnessed between 2023 and 2024, where inflow spikes frequently exceeded 1.2 to 1.5 million BTC, recent activity has remained significantly lower, averaging around 300,000 to 400,000 BTC. This divergence is a critical indicator: it shows that a greater proportion of Bitcoin is being moved off exchanges and into long-term storage, while fewer coins are actively rotating through major trading platforms. The net effect is a reduction in the liquid supply available for immediate trading, which inherently slows down short-term trading activity and contributes to the observed price compression. This reduction in liquid supply can be a precursor to future price appreciation, as less supply available on exchanges tends to amplify upward price movements when demand eventually picks up.
Broader Market Context and Macroeconomic Factors
The current corrective phase and the observed accumulation trends are not occurring in a vacuum; they are intrinsically linked to a broader market context and prevailing macroeconomic factors. The initial surge in Bitcoin’s price leading up to late January was largely fueled by optimism surrounding the approval and launch of spot Bitcoin Exchange-Traded Funds (ETFs) in the United States. These new investment vehicles introduced unprecedented institutional access to Bitcoin, leading to significant inflows and pushing prices to multi-year highs. However, the initial "buy the rumor, sell the news" dynamic, coupled with profit-taking from early investors, contributed to the subsequent correction.
Furthermore, the global macroeconomic environment continues to play a pivotal role. Concerns over persistent inflation, central bank monetary policies (particularly interest rate decisions by the U.S. Federal Reserve), and geopolitical tensions can all influence investor sentiment towards risk assets like Bitcoin. A period of higher interest rates or a stronger U.S. dollar typically creates headwinds for cryptocurrencies, as investors may prefer less volatile, yield-bearing assets. Conversely, expectations of interest rate cuts or a weakening dollar could reignite interest in Bitcoin. The current consolidation might reflect a period where the market is absorbing these macro uncertainties while simultaneously evaluating the long-term impact of institutional adoption via ETFs. While ETF inflows have been significant, the market is still digesting their full implications and the long-term capital flows they will attract.
Implications for Bitcoin’s Future Trajectory
The synthesis of technical and onchain data paints a nuanced picture for Bitcoin’s future trajectory. The current corrective phase, characterized by price compression within a well-defended demand zone, suggests a period of consolidation rather than a precipitous decline. The robust accumulation by long-term and retail-linked wallets, juxtaposed with reduced exchange activity, implies a gradual strengthening of Bitcoin’s underlying holder base. This "HODLing" behavior reduces the available liquid supply, setting the stage for potential future price appreciation once demand re-emerges.

Analysts generally interpret sustained accumulation during corrective phases as a bullish long-term signal. It indicates that conviction among a significant portion of the investor base remains strong, viewing price dips as opportunities to acquire more Bitcoin at perceived discounts. However, the softening liquidity conditions and the proximity to the realized price ($54,900) as a deeper support level also suggest that the market is not entirely out of the woods. A failure to hold the $60,000-$69,000 range could lead to further downside exploration, potentially testing the realized price or even lower levels if broader market sentiment deteriorates.
Historical Parallels and Expert Perspectives
Drawing parallels to past cycles, Bitcoin has frequently experienced significant corrections or consolidations after major price rallies or before major halving events. These periods often serve to "shake out" weaker hands and redistribute supply to stronger, long-term holders. The current phase exhibits characteristics reminiscent of these historical patterns, suggesting a natural market cycle at play rather than a fundamental breakdown. The halving event, which reduces the supply of new Bitcoin, often precedes significant bull runs, and the current accumulation could be viewed as positioning ahead of such potential future catalysts.
Expert perspectives, while cautious in the short term, largely maintain a positive outlook for Bitcoin in the long run. The continued institutional interest, the growing understanding of Bitcoin as a digital store of value, and its increasing integration into traditional finance ecosystems are often cited as fundamental drivers. The current data points towards a market in transition, moving from a period of high speculation and rapid price discovery to one of consolidation and strategic accumulation.
Conclusion and Outlook
In conclusion, Bitcoin is navigating a crucial corrective phase, marked by a retreat from its active supply cost price and a subsequent stabilization within a key demand zone between $60,000 and $69,000. This range is being staunchly defended by medium-term holders, whose coins have matured, creating a strong floor against further selling pressure. While liquidity conditions have softened and capital rotation has slowed, the underlying trend of long-term accumulation by retail and dedicated "HODLers" remains robust. This divergence—cooling short-term activity coupled with persistent long-term absorption—suggests a market in a state of rebalancing.

The coming months will be critical in determining Bitcoin’s next major move. Market participants will closely monitor the integrity of the $60,000-$69,000 support, the evolution of liquidity metrics, and the sustained pattern of accumulation. The interplay of these onchain signals with broader macroeconomic developments will ultimately shape whether Bitcoin embarks on a renewed ascent, enters a prolonged period of consolidation, or faces a deeper re-evaluation of its price levels. The current data, however, paints a picture of a resilient asset undergoing a necessary phase of consolidation and redistribution, preparing its foundation for future growth.
This article does not contain investment advice or recommendations. Every investment and trading move involves risk, and readers should conduct their own research when making a decision. While we strive to provide accurate and timely information, Cointelegraph does not guarantee the accuracy, completeness, or reliability of any information in this article. This article may contain forward-looking statements that are subject to risks and uncertainties. Cointelegraph will not be liable for any loss or damage arising from your reliance on this information.