
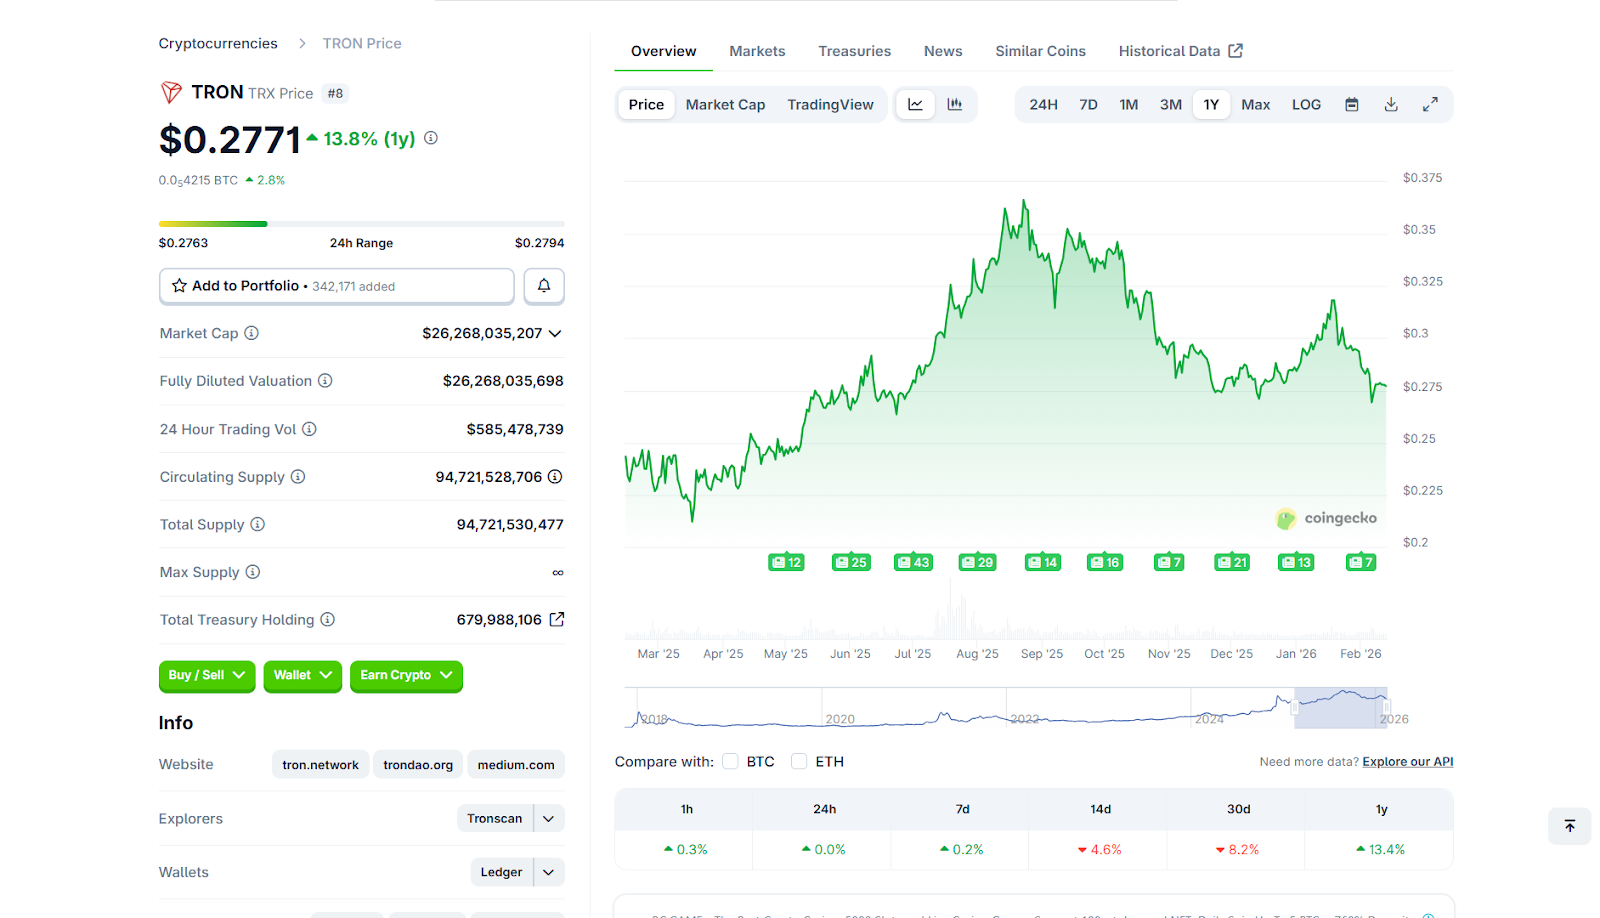
The TRON network, powered by its native TRX cryptocurrency, is positioned for steady growth through the latter half of the decade, demonstrating notable resilience in a perennially volatile digital asset market. As of mid-February 2026, TRX trades approximately at $0.278, having shown a slight recovery from recent minor dips. This upward momentum is largely attributed to continuous advancements within its network infrastructure, coupled with a discernible increase in user engagement and the expansion of its decentralized application (DApp) ecosystem. Industry analysts and market observers are increasingly forecasting a potential ascent for TRX, particularly as more applications and services opt to leverage its high-throughput, low-cost blockchain platform. This fundamental strength could solidify TRX’s standing as a prominent digital asset in the coming years, especially if broader cryptocurrency market trends shift towards a more definitively positive trajectory. This comprehensive analysis delves into TRON’s historical performance, its current market positioning, a detailed technical outlook, and realistic price forecasts spanning from 2026 through 2030, offering insights into the factors that could shape its future trajectory.
The Genesis and Evolution of TRON (TRX)
Founded by blockchain visionary Justin Sun in 2017, TRON emerged with an ambitious mission: to decentralize the internet and establish a global free content entertainment system with distributed storage technology. At its core, TRON aims to empower content creators by enabling them to connect directly with their audiences, thereby eliminating the need for traditional intermediaries that often extract significant fees and control over intellectual property. This creator-centric philosophy underpins its design, focusing on making digital content sharing both easier and more economical for users worldwide.
TRON’s blockchain is engineered for high performance, boasting impressive transaction speeds and remarkably low transaction fees. These characteristics have made it particularly appealing for a diverse range of applications, including gaming, video streaming, decentralized finance (DeFi) protocols, non-fungible tokens (NFTs), and various online financial tools. TRX, the native cryptocurrency of the TRON network, plays a pivotal role in this ecosystem. It serves multiple functions, including facilitating payments for network services, powering smart contract execution, and acting as a reward mechanism for network participants. The utility and accessibility of TRX have contributed significantly to TRON’s growth, cementing its status as one of the top blockchain platforms by active user base and transaction volume.
A key milestone in TRON’s evolution was the acquisition of BitTorrent in 2018, a move that integrated a vast existing user base into the TRON ecosystem and further solidified its focus on decentralized content distribution. Subsequent developments included the launch of its mainnet, the introduction of the TRC-20 token standard (similar to Ethereum’s ERC-20), and the steady proliferation of DApps built on the platform. The network’s robust support for stablecoins, particularly USDT on the TRC-20 standard, has also been a critical factor in its adoption, making it a preferred blockchain for high-volume, low-cost stablecoin transfers, especially within the Asian market.
TRX Market Snapshot: Mid-February 2026
As of February 12, 2026, TRX maintains a significant presence in the global cryptocurrency market. Its market capitalization stands at approximately $26 billion, a valuation that consistently places it among the top 10 digital assets by market cap. This strong market positioning underscores its established utility and investor confidence. The daily trading volume for TRX hovers around $603 million, indicating robust liquidity and sustained interest from both institutional and retail investors engaged in buying and selling activity.
The total supply of TRX coins exceeds 94 billion, with the vast majority already in circulation. This high circulating supply, coupled with a controlled token burn mechanism implemented by the TRON DAO, plays a crucial role in managing the token’s long-term supply dynamics and potential scarcity. Recent performance trends show TRX exhibiting steady behavior, registering a modest daily gain of approximately 1%. However, the token experienced a slight depreciation over the preceding week, mirroring a broader cautious sentiment pervading the wider cryptocurrency market. This broader market caution is often influenced by macroeconomic factors, evolving regulatory discussions, and geopolitical events that can impact investor risk appetite across the digital asset spectrum. Despite these fluctuations, TRX’s ability to maintain its market cap and trading volume demonstrates its underlying strength and the consistent utility derived from its network.
Historical Trajectory and Performance Benchmarks
TRON’s price history is characterized by a trajectory of consistent, albeit sometimes gradual, growth, largely unmarred by the extreme speculative bubbles seen in some other nascent cryptocurrencies. Since its inception, TRX has delivered remarkable returns, showcasing over 15,000% growth from its lowest recorded price points. This impressive appreciation is primarily attributable to the organic expansion of its ecosystem and increasing network utility rather than transient hype cycles.
Following its Initial Coin Offering (ICO) in 2017, TRX experienced initial volatility common to new digital assets. However, the subsequent launch of its mainnet, the establishment of the TRON DAO, and strategic developments such as the BitTorrent acquisition and the emphasis on stablecoin transactions (especially with Tether’s USDT migrating to TRC-20 in significant volumes) provided tangible use cases that underpinned its value proposition.
Unlike many projects that see parabolic rises followed by sharp corrections, TRON has often demonstrated a "slow and steady wins the race" approach. Its price movements have historically been tied closely to actual network milestones, such as increases in daily active users, transaction counts, the Total Value Locked (TVL) in its DeFi ecosystem, and the successful deployment of new DApps. For instance, periods of significant DApp launches or substantial growth in stablecoin transfers on TRON have frequently coincided with stable or ascending price action for TRX. This pattern suggests that its valuation is more closely linked to fundamental adoption and ecosystem strength, rather than speculative trading alone. While subject to broader market cycles, TRON has consistently shown an ability to recover and build upon previous gains, solidifying its reputation as a resilient asset in the crypto landscape.
In-Depth Technical Analysis: Navigating Current Market Signals
A detailed technical analysis of TRON (TRX) in mid-February 2026 reveals a market in a phase of balanced momentum, suggesting neither strong bullish nor pronounced bearish pressure dominates. TRX is currently holding key support levels, a positive indicator of underlying stability, while encountering moderate resistance at higher price points. This consolidation phase makes TRX an asset of interest for investors seeking potential entry opportunities during periods of market equilibrium.
Moving Averages: Indicators of Trend Strength
The relationship between TRX’s current price and its key moving averages provides critical insights into its short-to-medium term trend. At present, TRX is trading below both its 50-day Moving Average (MA) of $0.29 and its 200-day Moving Average (MA) of $0.31. This positioning is typically interpreted as a signal of consolidation rather than a clear upward breakout.
Being below these significant moving averages suggests that the short-term trend has lost some of its bullish impetus, and the long-term trend is not yet decisively upward. For momentum to improve and sentiment to shift more decisively bullish, TRX would need to execute a sustained move above its 200-day MA. A successful breach and hold above this level would indicate that buyers are gaining control and could signal the start of a more robust upward trend. Conversely, continued rejection at these moving average resistance levels could confine TRX within its current narrow trading range, reflecting ongoing market indecision and a lack of strong directional conviction.

Relative Strength Index (RSI): Gauging Momentum and Reversal Potential
The Relative Strength Index (RSI) is a momentum oscillator that measures the speed and change of price movements. For TRX, the daily RSI is currently fluctuating between 38 and 41. This range is firmly in the neutral territory, meaning the asset is neither overbought (typically above 70) nor deeply oversold (typically below 30).
A neutral RSI reading suggests that the immediate selling pressure that might have pushed the price down is beginning to dissipate. This fading selling pressure could potentially pave the way for a rebound if fresh buying interest emerges in the near term. An RSI in this range often precedes a period of accumulation or stabilization before a new trend potentially forms. Investors often monitor the RSI for divergences (when price makes a new high/low but RSI doesn’t, indicating weakening momentum) or for a move out of neutral territory to signal a potential shift in trend.
Key Price Levels: Support and Resistance Zones
Understanding key support and resistance levels is fundamental to technical analysis, as these are price points where buying or selling interest is expected to be concentrated.
Support Levels:
- S1: $0.275 – Immediate support, crucial for preventing further short-term declines.
- S2: $0.272 – A break below S1 would likely test this level next.
- S3: $0.271 – Stronger psychological and technical support.
- S4: $0.269 – If sustained selling occurs, this level becomes important.
- S5: $0.260 – A critical long-term support zone; a break below this could signal a more significant bearish trend.
Resistance Levels:
- R1: $0.280 – Immediate overhead resistance; a break here could signal short-term bullishness.
- R2: $0.281 – Overcoming this would show increasing buyer confidence.
- R3: $0.284 – A more significant hurdle, aligning with recent highs.
- R4: $0.290 – This level approaches the 50-day MA, making it a stronger resistance point.
- R5: $0.300 – A crucial psychological and technical resistance; breaching this could pave the way for a test of the 200-day MA and signify a more sustained rally.
These technical indicators collectively suggest that TRX is currently at a crossroads. Its ability to hold immediate support while challenging minor resistance levels will be critical in determining its short-term price direction. A decisive break above the 200-day moving average and the $0.300 resistance zone would be a strong bullish signal, whereas a fall below the $0.260 support could indicate further downside risk.
Expert Projections and Price Forecasts (2026-2030)
Forecasting cryptocurrency prices inherently involves a degree of uncertainty due to market volatility, technological advancements, and regulatory shifts. However, based on TRON’s fundamental strengths, its robust ecosystem, and current market dynamics, expert projections offer a structured outlook for TRX’s potential value in the coming years. These forecasts typically integrate technical analysis, on-chain metrics, fundamental analysis of network growth, and broader macroeconomic assumptions.
TRON TRX Price Prediction 2026
The year 2026 is anticipated to be a period of gradual, yet consistent, appreciation for TRX. The ongoing network improvements, coupled with increasing adoption of TRON’s fast and low-cost platform, are expected to fuel this growth.
| Month | Minimum Price (USD) | Average Price (USD) | Maximum Price (USD) | Expected ROI (%) |
|---|---|---|---|---|
| January | $0.27 | $0.29 | $0.31 | 4% |
| February | $0.28 | $0.30 | $0.32 | 7% |
| March | $0.29 | $0.31 | $0.33 | 11% |
| April | $0.30 | $0.32 | $0.34 | 14% |
| May | $0.31 | $0.33 | $0.35 | 18% |
| June | $0.32 | $0.34 | $0.36 | 21% |
| July | $0.33 | $0.35 | $0.37 | 25% |
| August | $0.34 | $0.36 | $0.38 | 29% |
| September | $0.35 | $0.37 | $0.39 | 32% |
| October | $0.36 | $0.38 | $0.40 | 36% |
| November | $0.37 | $0.39 | $0.41 | 39% |
| December | $0.38 | $0.40 | $0.42 | 43% |
The average price for TRX in 2026 is projected to reach approximately $0.35, with a potential high of $0.42 by year-end, representing a significant return on investment from current levels.
TRX Price Prediction 2027
Building on the momentum of 2026, TRON is expected to see continued expansion in 2027, driven by further DApp innovation and increasing global crypto adoption.
| Month | Minimum Price (USD) | Average Price (USD) | Maximum Price (USD) | Expected ROI (%) |
|---|---|---|---|---|
| January | $0.39 | $0.41 | $0.43 | 46% |
| February | $0.40 | $0.42 | $0.44 | 50% |
| March | $0.41 | $0.43 | $0.45 | 54% |
| April | $0.42 | $0.44 | $0.46 | 57% |
| May | $0.43 | $0.45 | $0.47 | 61% |
| June | $0.44 | $0.46 | $0.48 | 64% |
| July | $0.45 | $0.47 | $0.49 | 68% |
| August | $0.46 | $0.48 | $0.50 | 71% |
| September | $0.47 | $0.49 | $0.51 | 75% |
| October | $0.48 | $0.50 | $0.52 | 79% |
| November | $0.49 | $0.51 | $0.53 | 82% |
| December | $0.50 | $0.52 | $0.54 | 86% |
By December 2027, the average price could reach $0.52, with a maximum potential of $0.54, reflecting steady and significant gains.
TRX Price Prediction 2028
The year 2028 is anticipated to witness TRON’s ecosystem maturing further, potentially attracting more institutional interest and mainstream adoption, contributing to robust price growth.
| Month | Minimum Price (USD) | Average Price (USD) | Maximum Price (USD) | Expected ROI (%) |
|---|---|---|---|---|
| January | $0.51 | $0.53 | $0.55 | 89% |
| February | $0.52 | $0.54 | $0.56 | 93% |
| March | $0.53 | $0.55 | $0.57 | 96% |
| April | $0.54 | $0.56 | $0.58 | 100% |
| May | $0.55 | $0.57 | $0.59 | 104% |
| June | $0.56 | $0.58 | $0.60 | 107% |
| July | $0.57 | $0.59 | $0.61 | 111% |
| August | $0.58 | $0.60 | $0.62 | 114% |
| September | $0.59 | $0.61 | $0.63 | 118% |
| October | $0.60 | $0.62 | $0.64 | 121% |
| November | $0.61 | $0.63 | $0.65 | 125% |
| December | $0.62 | $0.64 | $0.66 | 129% |
By the end of 2028, TRX could average around $0.64, with a potential high of $0.66, reflecting a doubling of its current value.

Long-term Outlook: TRX Price Prediction for 2026, 2027, 2028, 2029, and 2030
The long-term outlook for TRX remains robust, predicated on its continued utility, developer activity, and strategic partnerships within the broader blockchain ecosystem.
| Year | Minimum Price (USD) | Average Price (USD) | Maximum Price (USD) | Potential ROI (%) |
|---|---|---|---|---|
| 2026 | $0.27 | $0.35 | $0.42 | 25% |
| 2027 | $0.39 | $0.46 | $0.54 | 64% |
| 2028 | $0.51 | $0.58 | $0.66 | 107% |
| 2029 | $0.60 | $0.68 | $0.75 | 143% |
| 2030 | $0.65 | $0.75 | $0.85 | 168% |
These predictions highlight a consistent upward trend, with the average price potentially reaching $0.75 by 2030, and maximum values touching $0.85 under favorable market conditions. This sustained growth is expected to be driven by TRON’s continued innovation and its critical role in the decentralized internet.
Factors Influencing TRON’s Price Dynamics
The valuation of TRX is shaped by a confluence of internal network dynamics and broader external market forces. Understanding these factors is crucial for investors assessing TRON’s potential.
- Network Activity and User Adoption: The health of the TRON network, measured by metrics such as the number of active addresses, daily transactions, and Total Value Locked (TVL) in its DeFi protocols, directly influences TRX’s value. Higher activity indicates greater utility and demand for the native token to pay for fees and participate in the ecosystem.
- Stablecoin Transactions: TRON has established itself as a dominant platform for stablecoin issuance and transfers, particularly USDT on TRC-20. The sheer volume and frequency of these transactions create consistent demand for TRX to cover network fees, thereby acting as a fundamental price driver.
- Tokenomics and Burn Mechanism: The TRON DAO has implemented token burn mechanisms, where a portion of transaction fees or other collected TRX is permanently removed from circulation. This deflationary pressure, by reducing the total supply of TRX over time, can contribute to increased scarcity and potentially higher prices, assuming demand remains constant or grows.
- Ecosystem Growth and Partnerships: The development of new decentralized applications (DApps), non-fungible token (NFT) projects, GameFi initiatives, and enterprise solutions on TRON expands its utility. Strategic partnerships with traditional businesses, payment processors, or other blockchain networks also enhance TRON’s reach and integration, driving demand for TRX.
- Regulatory Landscape: The evolving global regulatory environment for cryptocurrencies significantly impacts market sentiment. Favorable regulations can boost investor confidence and adoption, while restrictive policies or legal uncertainties can introduce volatility and dampen price prospects. TRON, like all major blockchains, is susceptible to these shifts.
- Broader Cryptocurrency Market Trends: As with most digital assets, TRX’s price movements are often correlated with the overall performance of the cryptocurrency market. Bull runs in Bitcoin or Ethereum can lift the entire market, including TRX, while market downturns can exert downward pressure. Macroeconomic factors such as inflation, interest rates, and global economic stability also play a role in investor risk appetite for volatile assets.
- Technological Advancements and Upgrades: Continuous development and implementation of technological upgrades, such as improvements in scalability, security enhancements, or new protocol features, can increase the network’s efficiency and appeal, thereby positively influencing TRX’s value.
Implications and Investment Considerations
TRON (TRX) has carved out a distinct and robust niche within the competitive cryptocurrency landscape. Its strategic focus on high-volume transactions, its significant role in the stablecoin ecosystem, and its continually expanding array of DeFi and NFT projects underscore its tangible utility in the real world. This fundamental utility provides a strong foundation for its long-term viability.
While TRX’s price often reflects the intensity of network activity and broader cryptocurrency market trends, it is also susceptible to short-term fluctuations driven by unexpected regulatory announcements or shifts in the global economic climate. Despite this inherent volatility, TRON has historically demonstrated a remarkable degree of resilience, recovering from downturns and building upon its core strengths.
For prospective investors, a discerning approach is essential. Keeping a vigilant eye on both TRON’s underlying network fundamentals – such as DApp growth, transaction volumes, and stablecoin dominance – and broader market data trends is paramount. The current technical analysis suggests a period of consolidation, which for some, might represent a strategic entry point. With consistent adoption, ongoing technological upgrades, and sustained demand for its efficient platform, TRX holds substantial potential for gradual, utility-driven long-term growth. However, the omnipresent volatility of the crypto market necessitates thorough due diligence and a clear understanding of the associated risks.
Frequently Asked Questions
Will TRX go up in 2026?
Yes, TRX is projected to experience modest but steady growth in 2026. According to expert analyses, the TRON coin prediction for 2026 places its value in a range of $0.27 to $0.42, with an anticipated average price of $0.35. Its inherent stability and ongoing network enhancements are expected to be key drivers.
Can TRON (TRX) reach $10?
Reaching a price of $10 is considered highly improbable in the near to medium term, given TRX’s current price hovering around $0.30 and its substantial total circulating supply. Such a monumental increase would necessitate an unprecedented level of global adoption, immense and sustained market demand, and prolonged, aggressive bullish market cycles far exceeding current expectations. Investors should maintain realistic expectations regarding long-term growth potential.
What will TRON be worth in 5 years?
In approximately five years, around 2031, TRX is projected to average between $0.80 and $1.00. Under exceptionally upbeat market scenarios and sustained network expansion, its maximum value could potentially reach $1.20. These forecasts hinge on continued ecosystem development, favorable regulatory environments, and overall positive health of the broader financial markets, offering solid returns but subject to market dynamics.
What factors influence TRX’s price the most?
The price of TRX is primarily influenced by several critical factors: active network usage, the volume of stablecoin transactions on the TRON blockchain, the strategic token burn mechanisms, new partnerships and integrations, and overarching cryptocurrency market trends. Additionally, regulatory developments worldwide play a significant role in influencing short-term volatility and investor sentiment.
What are the biggest risks to a TRX price forecast?
The biggest risks to TRX price forecasts include:
- Regulatory Uncertainty: Sudden changes in global cryptocurrency regulations could negatively impact TRON’s operations and market sentiment.
- Competition: Intense competition from other scalable blockchain platforms could divert users and developers.
- Market Volatility: The inherent volatility of the broader cryptocurrency market can lead to unpredictable price swings.
- Technological Flaws/Exploits: Any security breaches or major technical issues within the TRON network could severely damage trust and price.
- Centralization Concerns: Criticisms regarding TRON’s level of decentralization could affect its long-term appeal.
TRX is widely available on most major cryptocurrency exchanges, including prominent platforms such as Binance, OKX, Kraken, KuCoin, and Coinbase. For enhanced security, it is highly recommended to store TRX in hardware wallets (e.g., Ledger, Trezor) or reputable software wallets that explicitly support the TRON network. Always enable two-factor authentication (2FA) on exchange accounts and wallets for an added layer of protection against unauthorized access.