
Candlestick charts are an indispensable tool for traders seeking to visualize price movements and interpret market behavior with profound depth. Unlike simpler line charts, which merely connect closing prices, candlestick charts offer a comprehensive snapshot of a trading session, revealing the open, high, low, and close prices within a single, visually intuitive candle. This rich data allows market participants to quickly discern the underlying dynamics of supply and demand, determining whether buyers or sellers exerted dominance during a given period and identifying crucial patterns that often signal potential trend reversals or continuations. These patterns range from foundational single-candle formations, such as the powerful hammer or the cautionary shooting star, to complex multi-candle sequences like the optimistic morning star, the warning evening star, and the robust three white soldiers. This article will meticulously explain the fundamental components and characteristics of a candlestick, elucidate how to interpret both single and multiple candles in concert, thoroughly explore a spectrum of bullish and bearish patterns, and critically demonstrate the strategic application of candlestick charts within the dynamic realm of crypto trading.
The Historical Genesis of Candlestick Charting
The art of candlestick charting is not a modern innovation but a technique with a rich history stretching back to 18th-century Japan. It was pioneered by Munehisa Homma, a legendary rice merchant from Sakata, who is widely credited with developing this sophisticated method to track and predict rice prices. Homma’s brilliance lay in his understanding that market prices were not solely driven by the intrinsic value of the commodity but also by the collective emotions of traders. His charts documented how prices opened, reached their highs and lows, and ultimately closed within each period, allowing him to observe recurring patterns that indicated shifts in market sentiment, supply, and demand long before these terms were commonplace in Western finance.
Homma’s methods, initially shared through handwritten scrolls, provided a significant competitive edge in the highly volatile rice markets of his time. It wasn’t until the late 20th century that candlestick charting transcended its Eastern origins and was introduced to Western financial markets by Steve Nison through his seminal work, "Japanese Candlestick Charting Techniques." Nison’s efforts propelled candlesticks into the mainstream of technical analysis, where their ability to visually convey both price direction and market momentum quickly established them as a core analytical tool. Today, their strength lies in their unparalleled capacity to offer traders deep insights into market psychology, making them particularly valuable in the 24/7, high-volatility environment of cryptocurrency trading.

Dissecting the Anatomy of a Candlestick
A single candlestick encapsulates four critical pieces of price information for a specific timeframe: the open, high, low, and close (OHLC). These four data points construct the "body" and "wicks" (or "shadows") of the candle, providing an immediate visual representation of market activity.
- The Real Body: This is the thickest part of the candle. It represents the range between the open and close prices.
- Bullish Candle (Typically Green or White): If the closing price is higher than the opening price, the candle is bullish. A long green body indicates strong buying pressure, meaning buyers were in control and pushed prices significantly higher during the period.
- Bearish Candle (Typically Red or Black): If the closing price is lower than the opening price, the candle is bearish. A long red body signifies strong selling pressure, indicating sellers dominated and drove prices down substantially.
- Small Body: A short body, regardless of color, suggests minimal price movement between the open and close, often signaling market indecision or consolidation.
- The Wicks (Shadows): These are the thin lines extending above and below the real body.
- Upper Wick: The line extending from the top of the real body to the highest price reached during the period. A long upper wick suggests that buyers initially pushed prices higher, but sellers eventually drove them back down before the close.
- Lower Wick: The line extending from the bottom of the real body to the lowest price reached during the period. A long lower wick indicates that sellers initially pushed prices lower, but buyers ultimately drove them back up before the close.
Understanding these components is foundational. For instance, a candle with a small body and long wicks in both directions (like a Doji) visually communicates a fierce battle between buyers and sellers that ended in a stalemate, implying market indecision. Conversely, a candle with a large body and minimal wicks clearly shows strong, directional momentum, with one side overwhelmingly dominating the session.
Interpreting Single Candlesticks for Market Insight
While context is paramount, a single candlestick can offer a potent snapshot of market sentiment within its specific timeframe. It visually communicates whether buyers or sellers exerted control over the price and the intensity of that control.
- Long Bullish Body (Green/White): Suggests strong buying pressure. Buyers were aggressive throughout the period, pushing the price significantly higher from open to close. This often signals conviction and can indicate a continuation of an uptrend or the beginning of a reversal from a downtrend.
- Long Bearish Body (Red/Black): Indicates powerful selling pressure. Sellers maintained control, driving the price substantially lower from open to close. This often suggests bearish conviction and can signal a continuation of a downtrend or the start of a reversal from an uptrend.
- Small Body (Bullish or Bearish): Implies market indecision or a period of consolidation. Neither buyers nor sellers were able to decisively move the price in one direction. This can be a precursor to a larger move in either direction, depending on subsequent candles.
- Long Upper Wick, Small Body: Signals that buyers attempted to push prices higher, but strong selling pressure emerged, rejecting the higher prices and pushing the close back down near the open or even below it. This is often a bearish signal, particularly after an uptrend.
- Long Lower Wick, Small Body: Indicates that sellers tried to drive prices lower, but significant buying pressure appeared, rejecting the lower prices and pushing the close back up near the open or above it. This is typically a bullish signal, especially after a downtrend.
Crucially, a single candle rarely provides a standalone, reliable trading signal. Its true utility emerges when considered within the broader market context: the prevailing trend, proximity to key support and resistance levels, and the overall market structure. Integrating volume data further enhances the usefulness of candlestick information. High volume accompanying a strong directional candle reinforces the conviction of that move, while low volume might suggest a less reliable signal. This combination helps traders make more informed decisions and can contribute to more accurate predictions for cryptocurrencies like Bitcoin.
Key Bullish Candlestick Patterns Signaling Potential Upswings
Bullish candlestick patterns typically appear during or after a downtrend, signaling a potential shift in momentum from sellers to buyers and indicating an upcoming price increase.
-
Hammer: This single-candle pattern features a small real body positioned near the top of the candle, a long lower shadow (at least twice the length of the body), and little to no upper shadow. The hammer forms when sellers initially drive the price down significantly, but buyers aggressively step in, pushing the price back up to close near or above the opening price. This visually represents the market "hammering out a bottom." It is most effective when it appears after a sustained decline or near a confirmed support level. Traders often await confirmation from the subsequent candle—ideally, a strong bullish candle—before entering a long position. The Inverted Hammer is a similar pattern, characterized by a small body near the bottom, a long upper shadow, and little to no lower wick, resembling an upside-down hammer. It also suggests a potential bullish reversal.
-
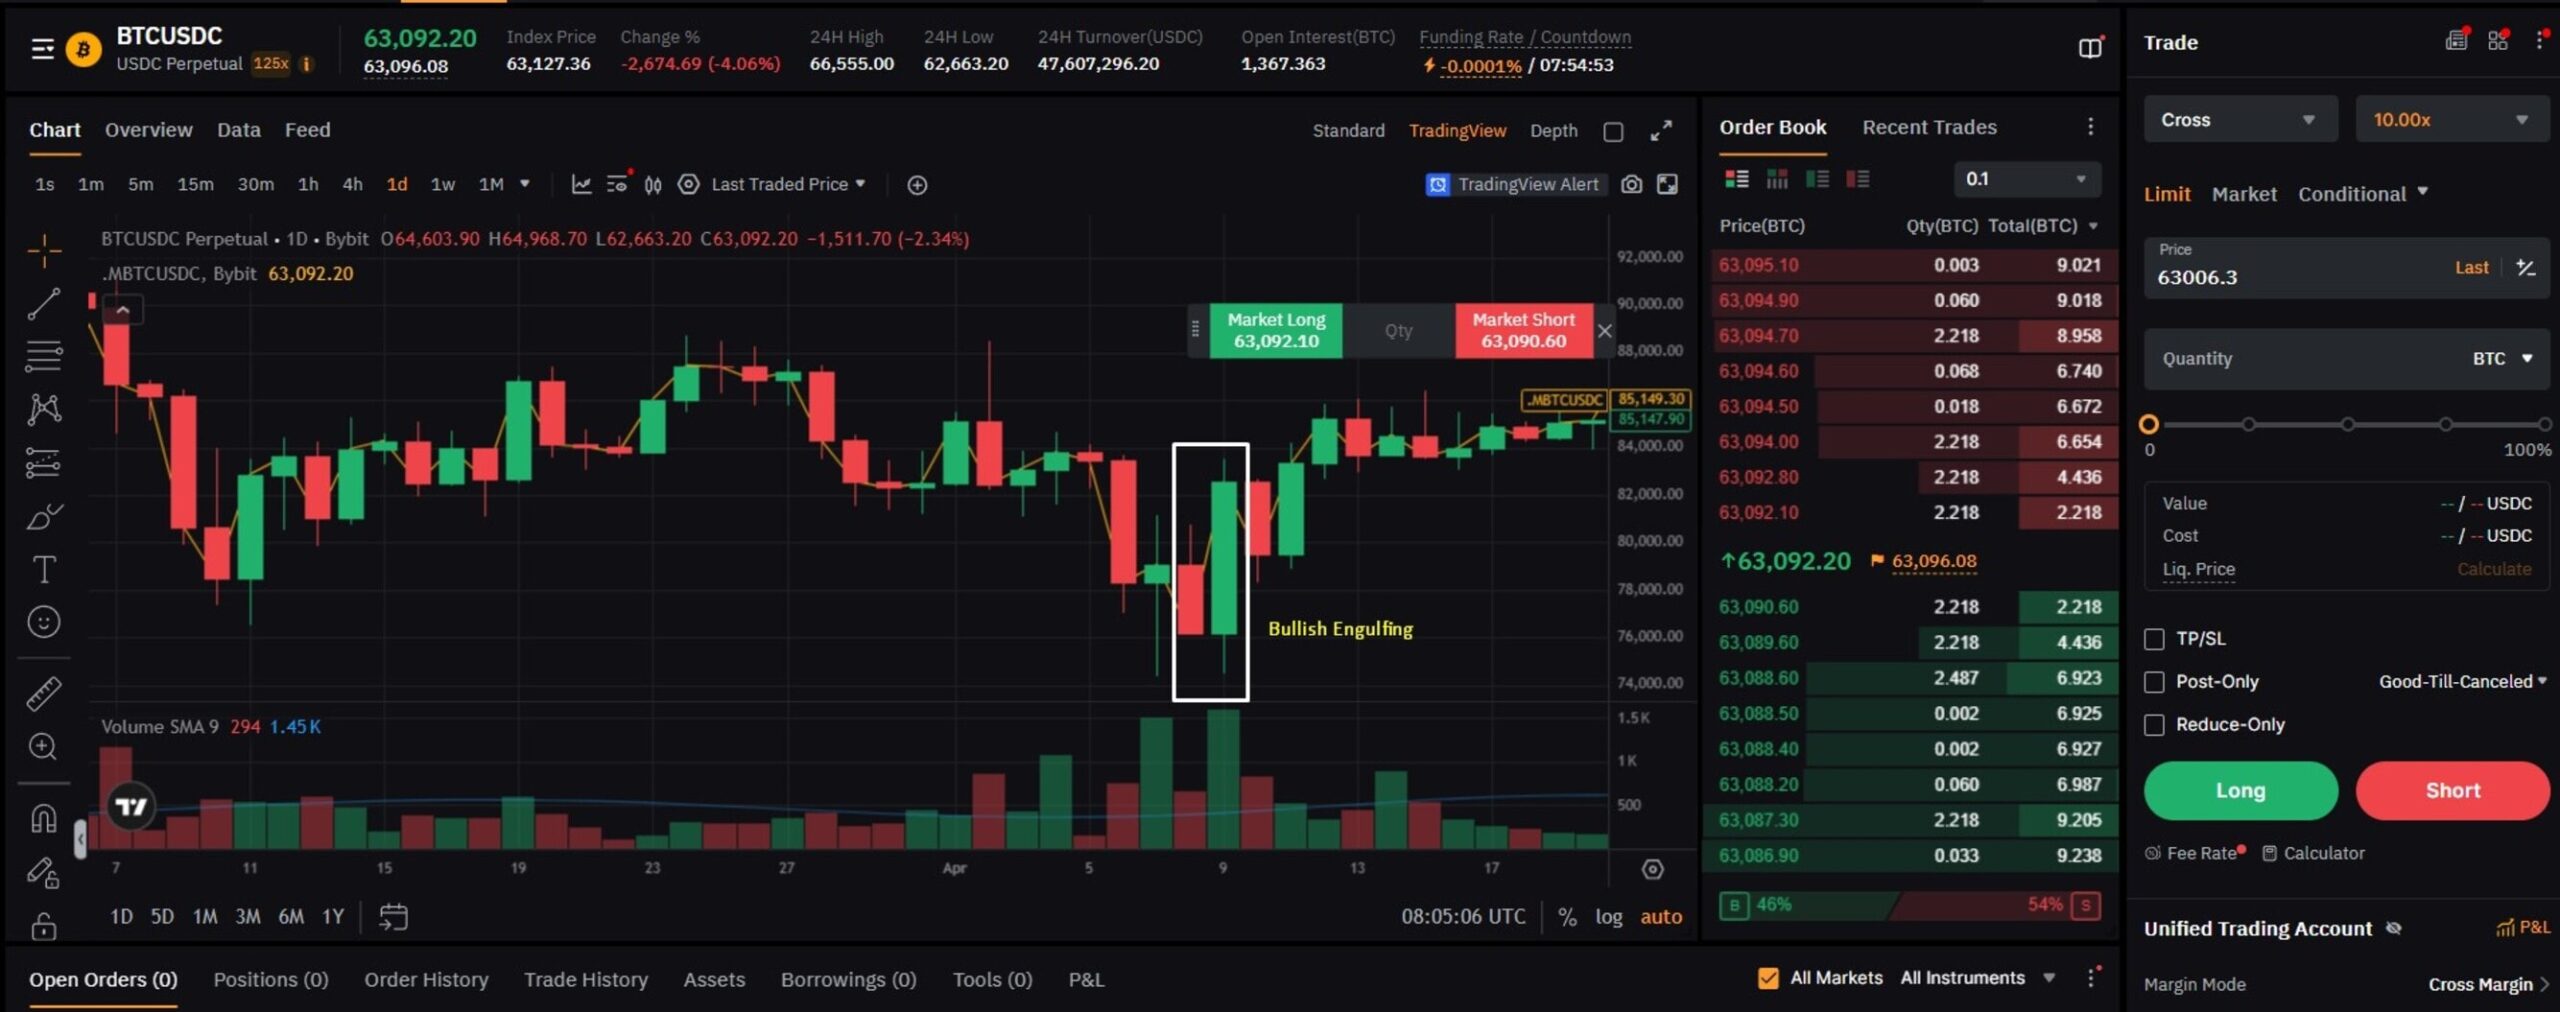
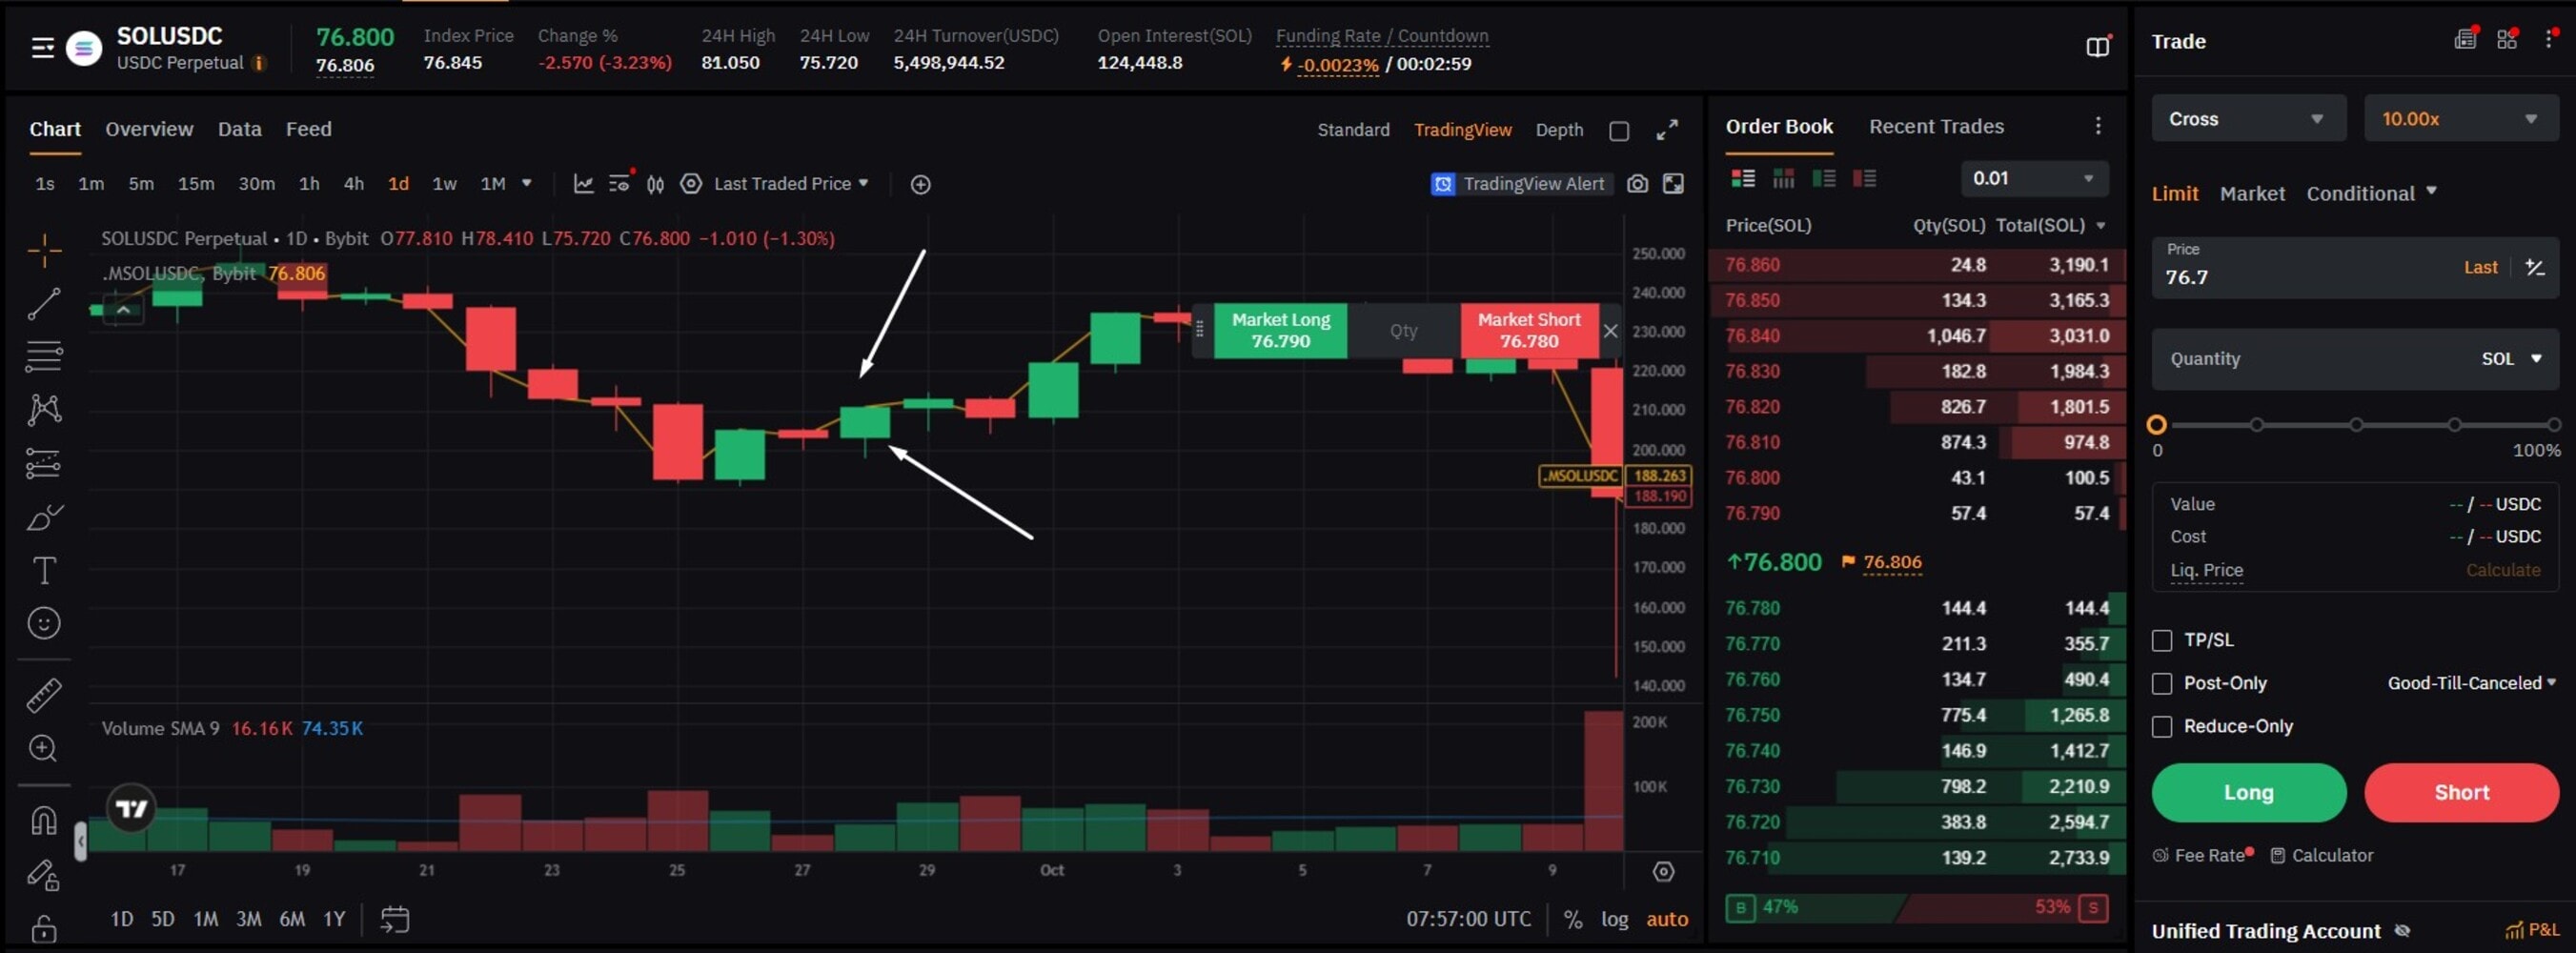
Bullish Engulfing Pattern: A powerful two-candle reversal pattern, the bullish engulfing pattern occurs when a small bearish (red) candle is immediately followed by a larger bullish (green) candle that completely "engulfs" the real body of the preceding bearish candle. This visually demonstrates a decisive shift in market control from sellers to buyers. The pattern’s reliability is significantly enhanced if it appears at the end of a downtrend or a pullback within an uptrend. Volume confirmation is critical: higher trading volume during the engulfing bullish candle suggests genuine and robust buying interest rather than a fleeting price fluctuation.
-
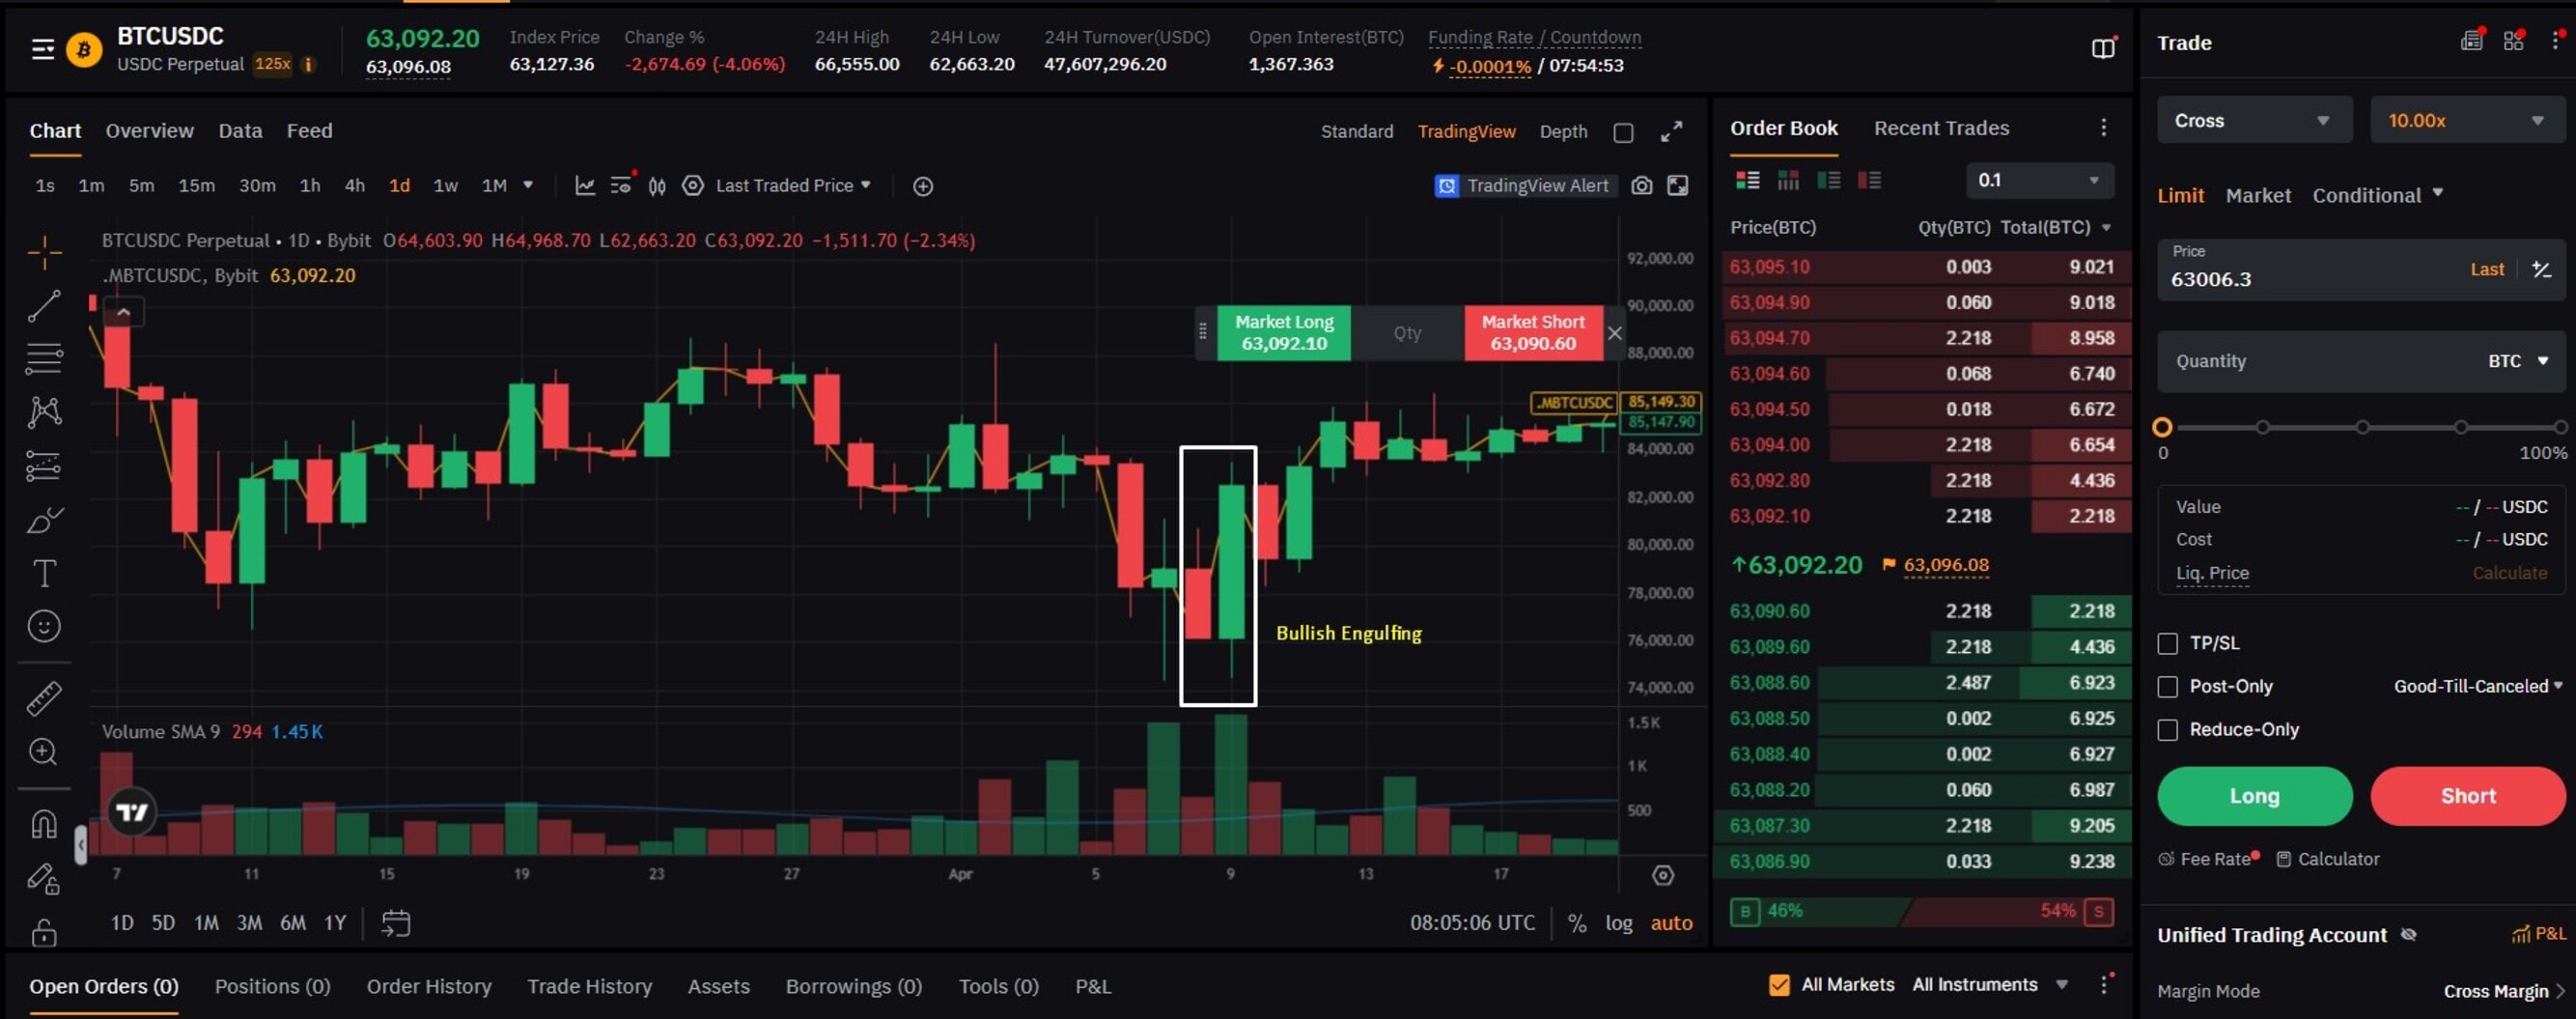
Morning Star: A three-candle pattern, the morning star is a strong indicator of a potential reversal from a downtrend to an uptrend. It commences with a large bearish candle, reflecting strong selling pressure. The second candle is a small-bodied candle (which can be either bullish or bearish, or even a Doji), signaling market indecision and a weakening of the bearish momentum. The pattern concludes with a strong bullish candle that closes well into or above the midpoint of the first bearish candle. This sequence illustrates the fading of selling pressure, a period of uncertainty, and the subsequent emergence of strong buyer confidence. Traders frequently seek this pattern near established support levels and combine it with trend analysis and increasing volume to confirm the bullish reversal.
-
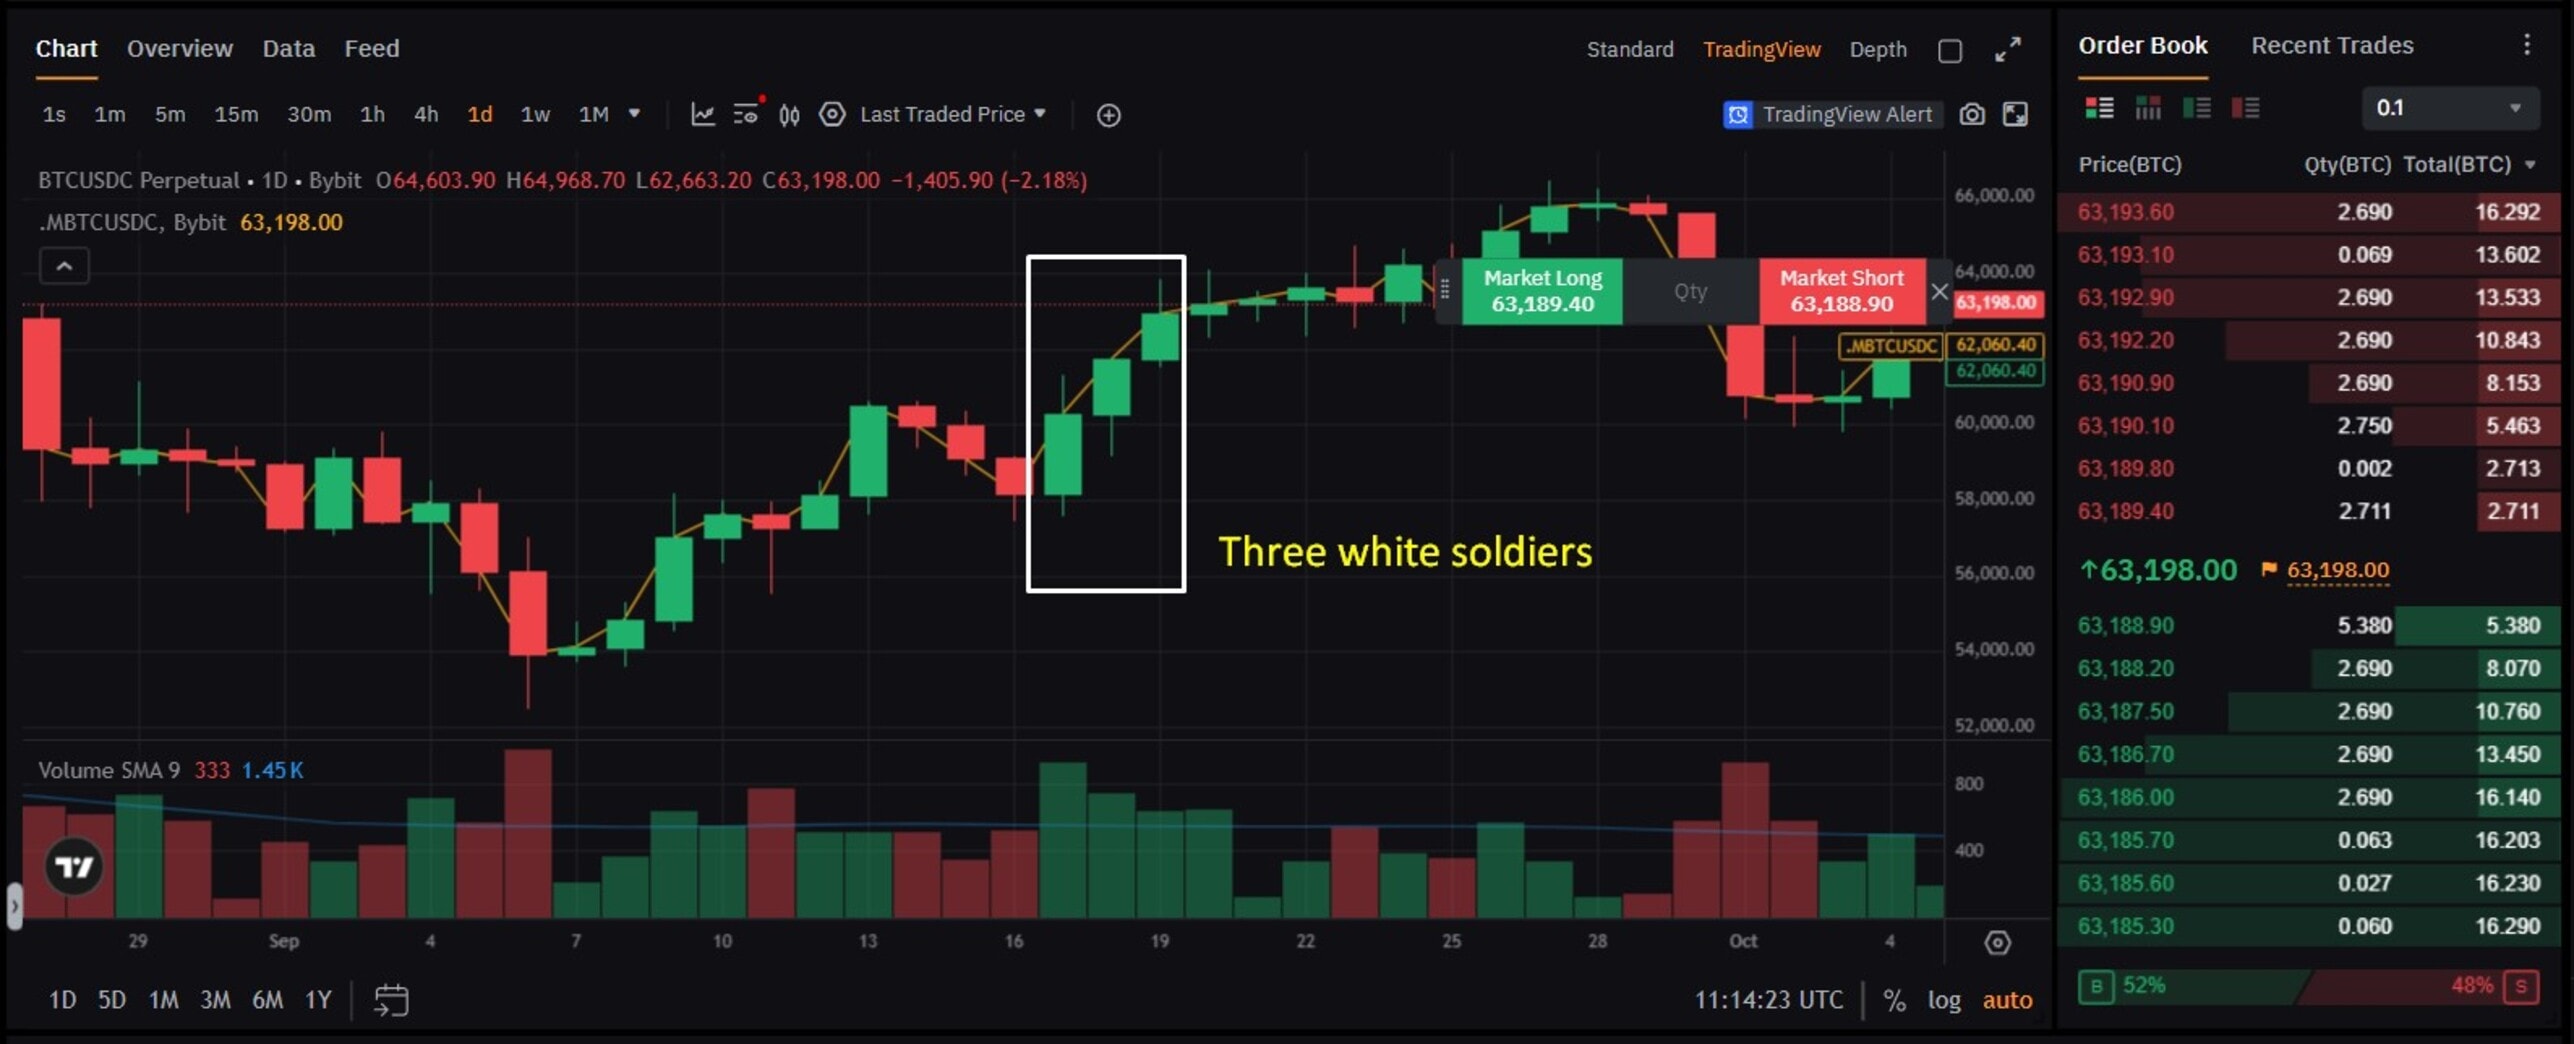
Three White Soldiers: This is a highly bullish reversal pattern that typically forms after a bearish downtrend or a period of consolidation, signaling the onset of strong and sustained buying momentum. It is characterized by three consecutive long bullish (green) candles. Each candle should open within the body of the previous candle and close higher than the previous candle, often with small or absent upper wicks. This pattern indicates consistent and aggressive buying pressure, with buyers maintaining control throughout successive periods. Its appearance suggests a robust shift in market sentiment and a high probability of continued upward price action.
Identifying Bearish Candlestick Patterns for Downside Potential
Bearish candlestick patterns generally emerge during or after an uptrend, signaling a potential shift in momentum from buyers to sellers and indicating an impending price decline.
-
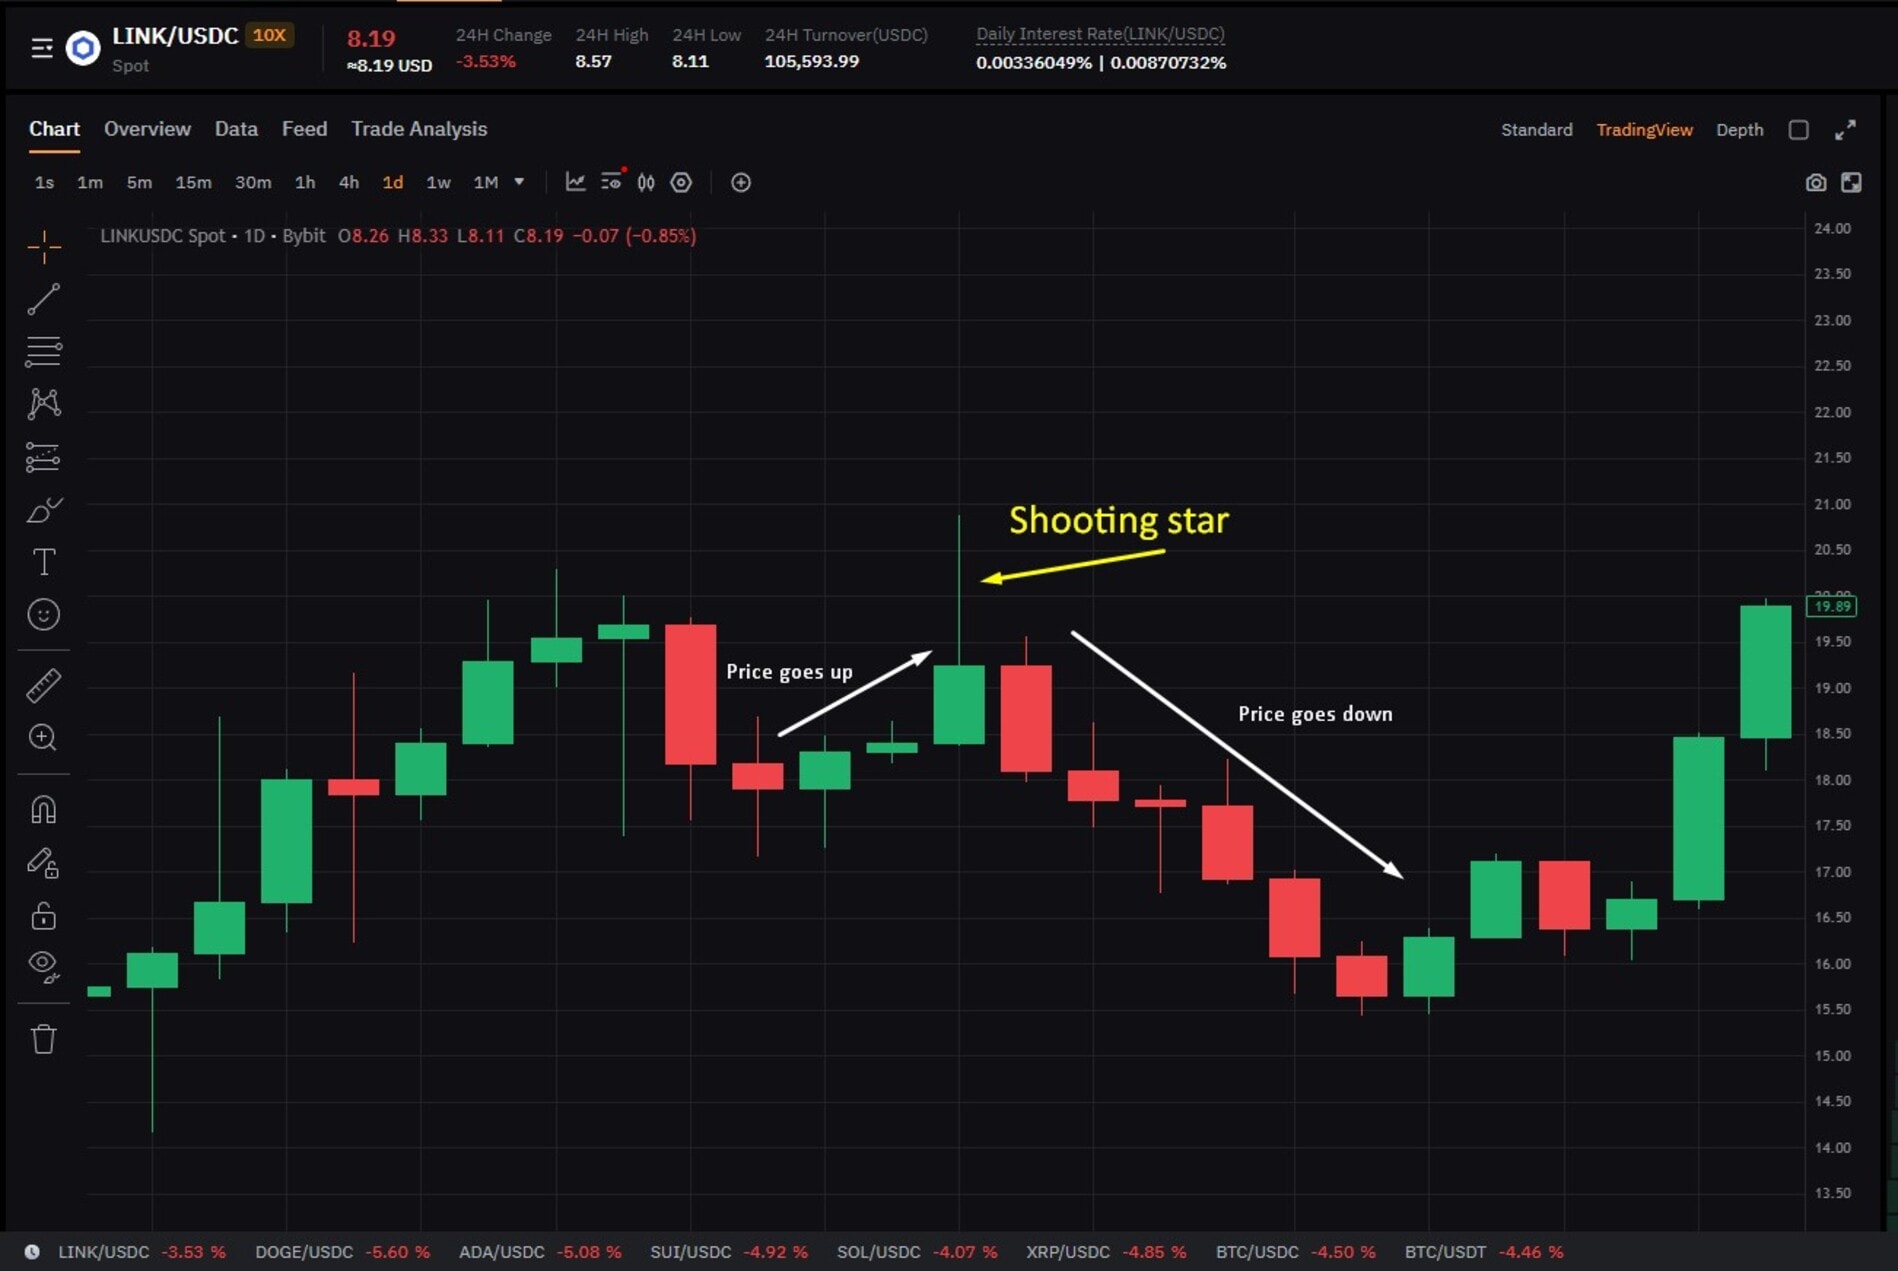
Shooting Star: The shooting star is a single-candle pattern that mirrors the hammer but appears after an uptrend. It has a small real body positioned near the bottom of the candle, a long upper shadow (at least twice the length of the body), and little to no lower shadow. This pattern forms when buyers attempt to push the price higher during the session, but sellers overwhelmingly regain control, rejecting the higher prices and forcing the close near or below the opening price. The long upper wick is a clear visual representation of price rejection at higher levels and signals a potential bearish reversal. As with its bullish counterpart, traders typically await confirmation from the next candle—ideally, a strong bearish candle—before considering a short position.
-
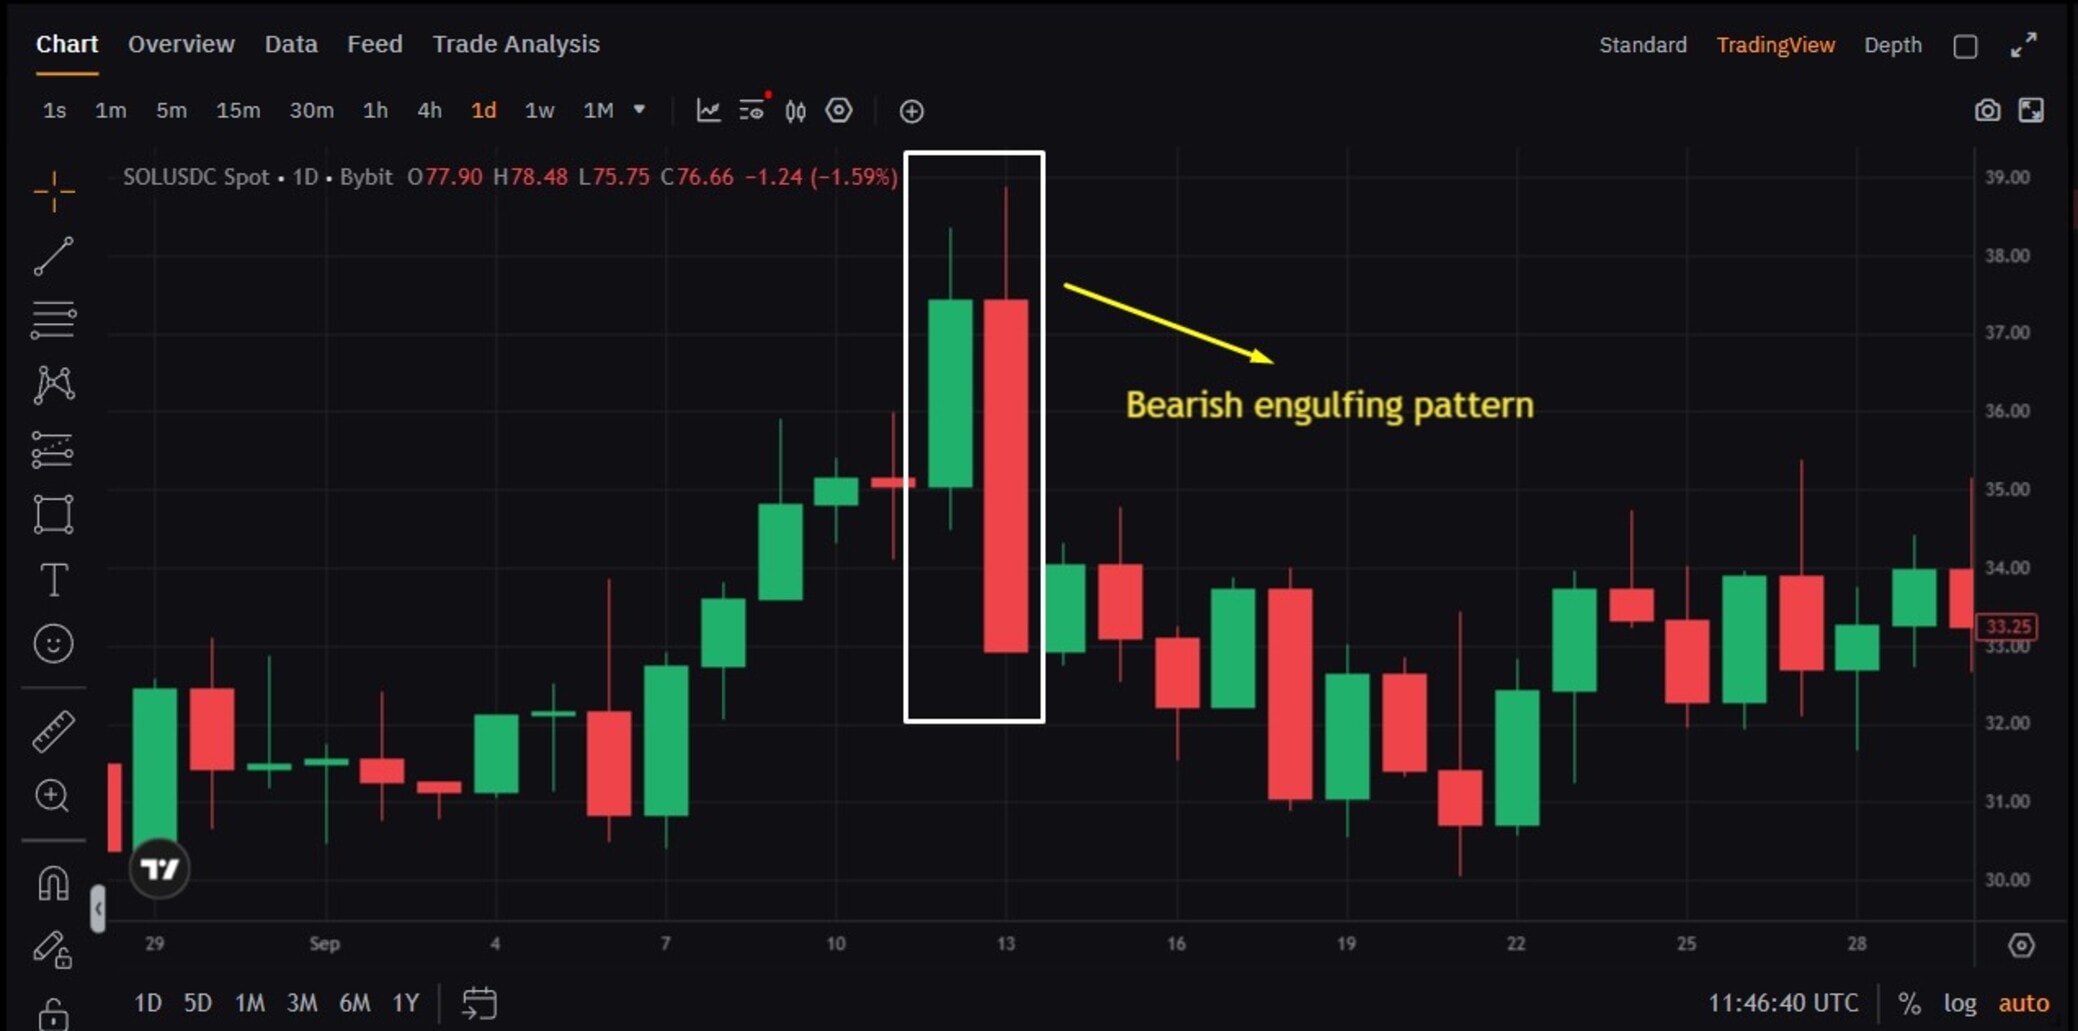
Bearish Engulfing: The bearish engulfing pattern is the inverse of its bullish counterpart and is a powerful two-candle reversal signal. It occurs when a small bullish (green) candle is followed by a larger bearish (red) candle that completely "engulfs" the real body of the preceding bullish candle. This pattern emphatically indicates a shift from buying pressure to dominant selling pressure. Its strength is amplified when it forms after a clear uptrend or near a significant resistance level. High trading volume during the engulfing bearish candle further adds credibility, demonstrating active and decisive selling interest in the market.
-
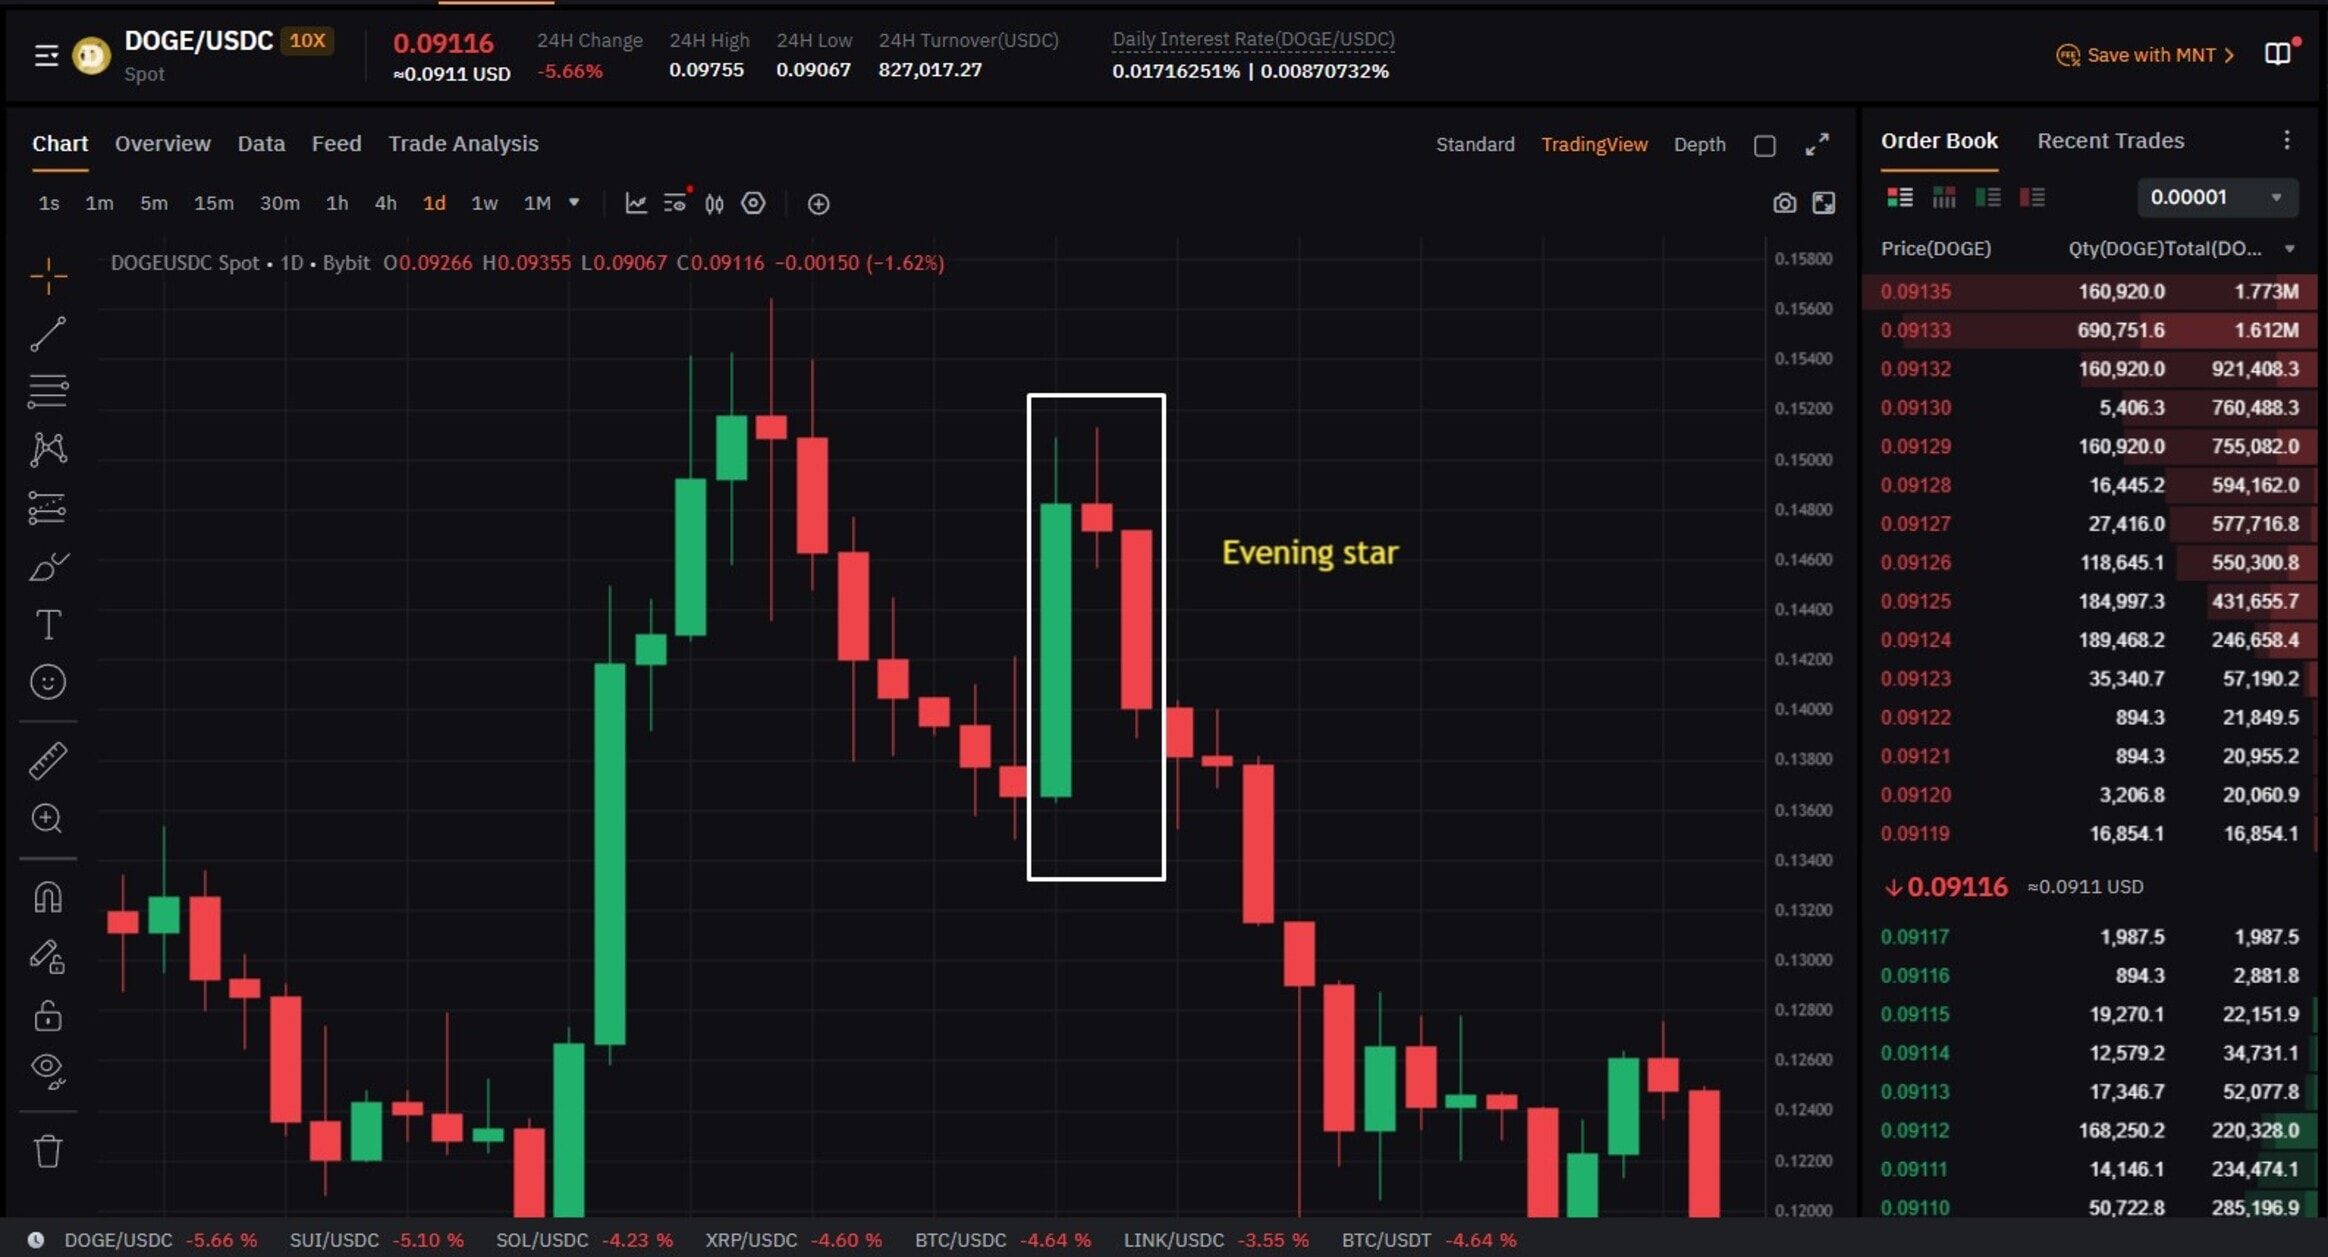
Evening Star: The evening star is a three-candle bearish reversal pattern that typically appears after an uptrend, signaling a weakening of buying momentum and a potential top. It begins with a large bullish candle, reflecting strong buying. The second candle is a small-bodied candle (bullish, bearish, or Doji), indicating market indecision and a deceleration of the uptrend. The pattern culminates with a strong bearish candle that closes significantly into or below the midpoint of the first bullish candle. This sequence illustrates the exhaustion of buying pressure, a period of uncertainty, and the subsequent emergence of strong selling confidence. Traders often look for this pattern near resistance levels, confirming the reversal with declining volume on the second candle and increasing volume on the third.
-
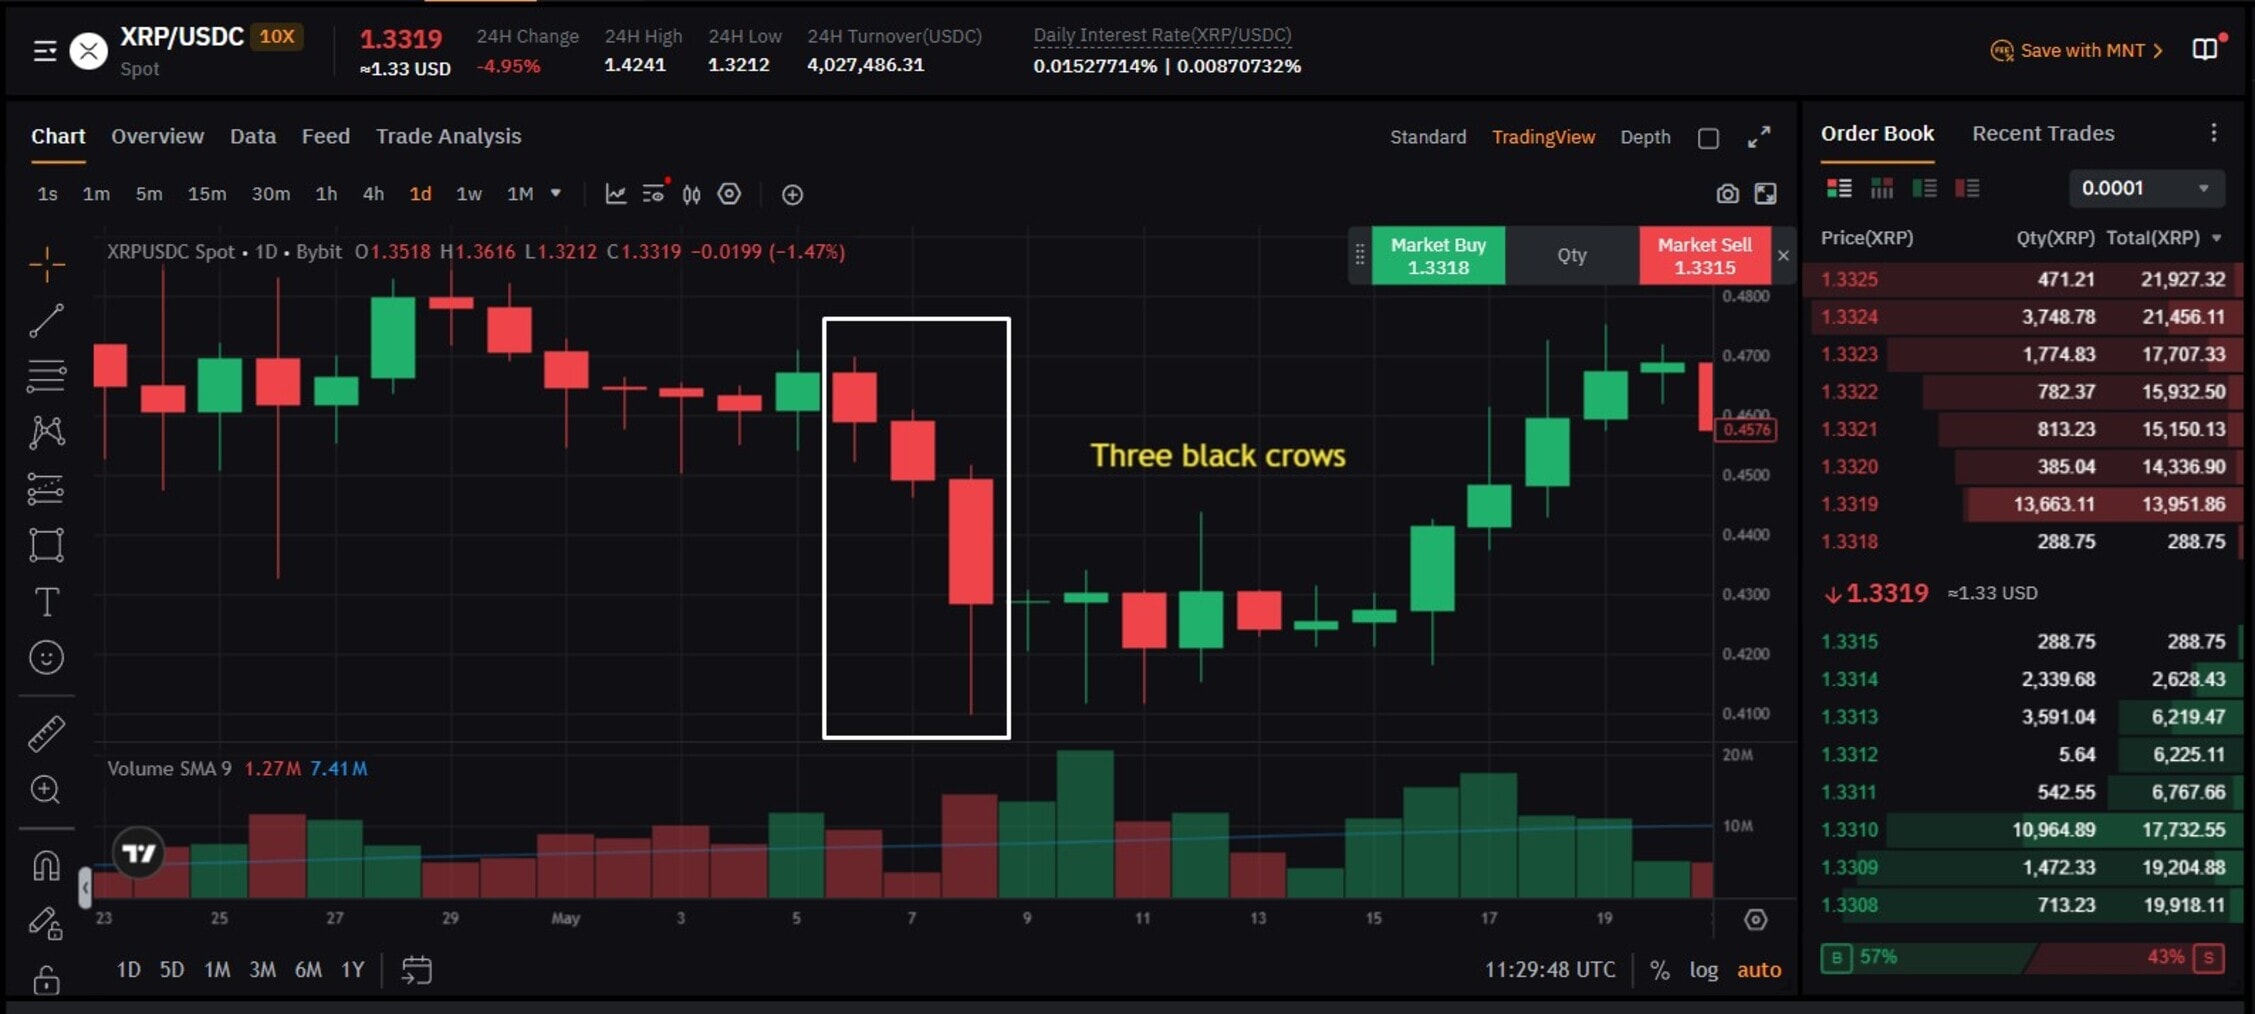
Three Black Crows: This pattern is the bearish equivalent of the Three White Soldiers and signals strong and sustained selling pressure, typically appearing after an uptrend or a period of consolidation. It consists of three consecutive long bearish (red) candles. Each candle should open within the body of the previous candle and close lower than the previous candle, often with small or absent lower wicks. This pattern indicates a consistent and aggressive take-over by sellers, suggesting a robust shift in market sentiment towards the downside and a high probability of continued downward price action. Traders should monitor nearby support levels as a potential bounce could occur if the asset becomes significantly oversold.
Continuation Candlestick Patterns: Pauses Before the Next Move
Continuation patterns are crucial for traders as they suggest that the prevailing trend is likely to persist after a temporary pause or minor retracement, rather than reversing. These patterns are particularly useful for identifying brief periods of consolidation or hesitation within an ongoing trend. The reliability of these patterns significantly improves when combined with the overall trend context, established support and resistance levels, and volume analysis.
-
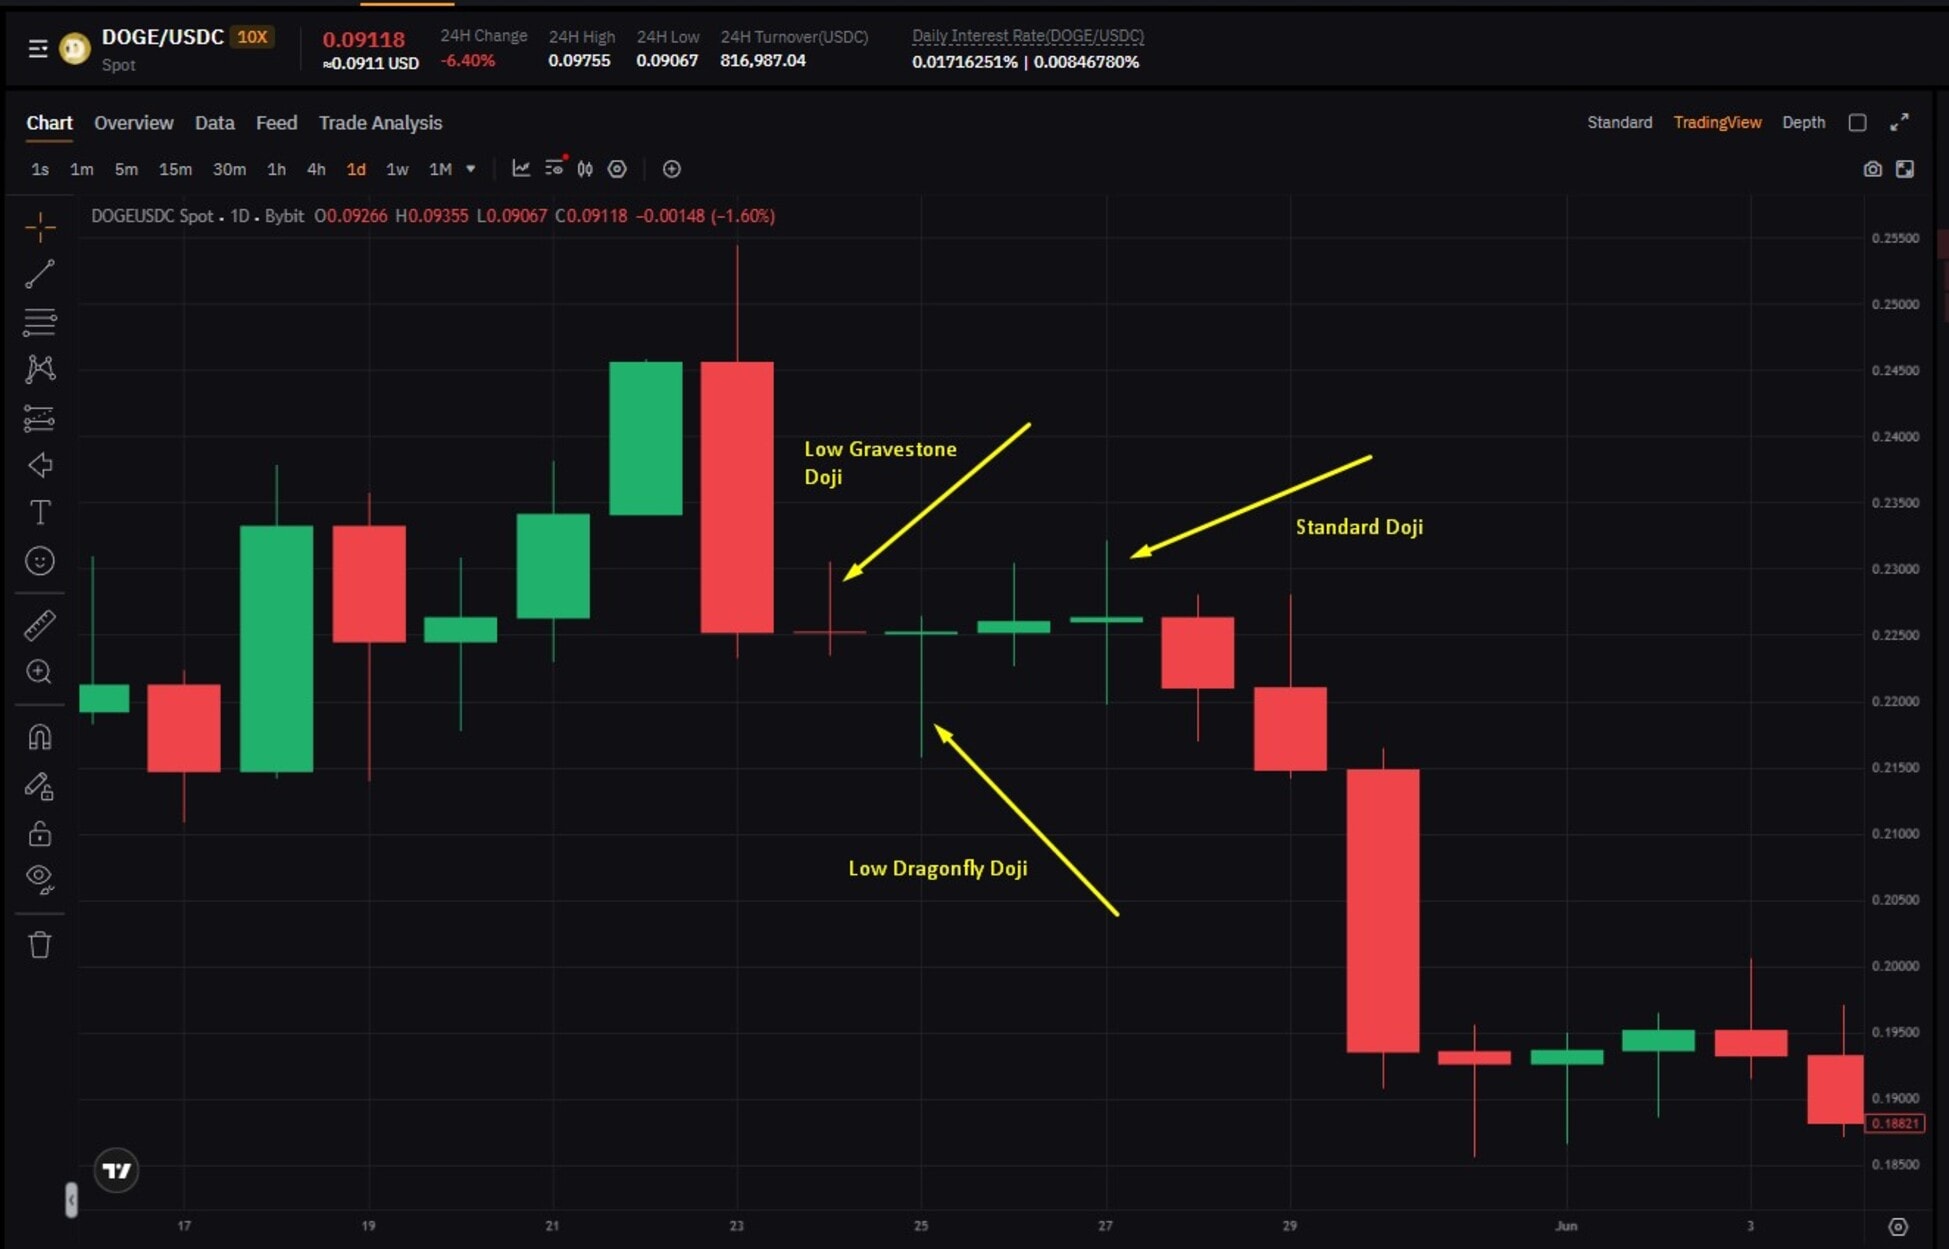
Doji: A Doji forms when the open and close prices of a candle are nearly identical, resulting in a very small or almost invisible real body. This indicates a state of equilibrium or indecision in the market, where buying and selling pressures were perfectly balanced within the period.
- Types of Doji:
- Standard Doji: Small body, small wicks.
- Long-Legged Doji: Small body, very long upper and lower wicks, emphasizing extreme indecision and volatility.
- Gravestone Doji: Small body at the low of the candle, long upper wick, no lower wick. A bearish signal if it appears after an uptrend, as buyers tried to push up but failed.
- Dragonfly Doji: Small body at the high of the candle, long lower wick, no upper wick. A bullish signal if it appears after a downtrend, as sellers tried to push down but failed.
- Interpretation: In a bullish trend, a Doji can signal a temporary pause or profit-taking before the price potentially resumes its upward trajectory. Conversely, a Doji in a bearish trend might signal a short-term consolidation before a further decline. Volume and the context around support or resistance levels are vital for determining whether the trend will continue or if the Doji might be a precursor to a reversal.
- Types of Doji:
-
Rising Three Methods: This is a robust bullish continuation pattern, typically appearing within an established uptrend. It is composed of five candles:
- A strong, long bullish candle.
- Followed by three small bearish or neutral candles that trade within the range of the first bullish candle. These small candles represent a temporary pause or minor profit-taking.
- The pattern concludes with another strong, long bullish candle that closes above the high of the first candle, confirming that buyers have regained control and the uptrend is resuming.
This pattern clearly illustrates that despite a brief period of selling pressure or indecision, buyers remain firmly in control. Traders often interpret this as a signal to hold existing long positions or consider adding to them, anticipating continued upward momentum.
-
Falling Three Methods: The bearish counterpart to the rising three methods, this pattern signals a bearish continuation within an established downtrend. It also consists of five candles:
- A strong, long bearish candle.
- Followed by three small bullish or neutral candles that trade within the range of the first bearish candle. This signifies a temporary pause or a minor counter-trend rally.
- The pattern concludes with another strong, long bearish candle that closes below the low of the first candle, confirming renewed selling pressure and the resumption of the downtrend.
This pattern indicates that despite a brief period of buying interest, sellers maintain overall control. Traders use this pattern to anticipate further downward movement, potentially planning new short entries or managing risk in existing short positions.
-
Spinning Top: A spinning top is characterized by a small real body with relatively long upper and lower wicks. This pattern indicates a period where both buyers and sellers were active, but neither side managed to gain a decisive advantage, resulting in the close being very near the open.
- Interpretation in Context: In an established uptrend, a spinning top often signals a brief consolidation or a moment of indecision before the bullish trend potentially continues. In a downtrend, it indicates hesitation before the bearish trend resumes. While similar to a Doji, the spinning top’s small body suggests a slightly more defined, albeit still limited, price movement. Spinning tops become more meaningful when analyzed alongside the prevailing trend direction, trading volume, and their proximity to significant support or resistance levels to confirm whether the market is likely to continue its current trajectory.
Reading Multiple Candlesticks Together: A Holistic View
While individual candlesticks offer valuable insights, analyzing multiple candles in sequence provides a far more robust and reliable understanding of market dynamics, revealing stronger signals about trends, potential reversals, and periods of consolidation.
-
Identifying Trends: When a series of bullish candles consistently forms higher highs and higher closes, it unequivocally signals an uptrend, indicating sustained buying pressure. Conversely, a succession of bearish candles forming lower lows and lower closes clearly points to a downtrend, reflecting persistent selling pressure. Traders can leverage these visual sequences to confirm the market’s prevailing direction before committing to positions. Closely observing the size of the candle bodies and the relative lengths of their wicks across several periods helps to accurately gauge the strength and conviction of the ongoing trend. Larger bodies with minimal opposing wicks suggest stronger momentum.
-
Spotting Reversals: Reversal signals gain significantly more credibility when multiple candles collaboratively indicate a shift in the balance of power between buyers and sellers. Patterns such as the morning star, evening star, or sequences of bullish and bearish engulfing patterns spanning several candles strongly suggest that the prevailing momentum is changing direction. Reversal signals are most potent and reliable when they manifest near established support or resistance levels. Their strength is further amplified when confirmed by an increase in trading volume during the reversal candles, indicating genuine market participation in the shift.
-
Reading Consolidation: Consolidation periods are characterized by multiple small-bodied candles forming within a narrow price range, often exhibiting wicks on both ends, signifying market indecision or a temporary pause. This phase represents a temporary equilibrium where neither buyers nor sellers can decisively move the price. Traders can strategically utilize consolidation patterns to anticipate impending breakouts (price moving above resistance) or breakdowns (price moving below support), especially when these patterns occur near significant trendlines or horizontal support and resistance levels. A breakout from consolidation often indicates the resumption or acceleration of the previous trend or the start of a new one.
Reading multiple candlesticks in combination provides a more complete and nuanced picture than isolated candle analysis. This integrated approach empowers traders to interpret momentum, identify critical pressure points, and anticipate potential turning points with a significantly higher degree of confidence, thereby enhancing their overall trading strategy.
Strategic Application of Candlestick Charts in Crypto Trading
Candlestick charts are particularly well-suited for the unique characteristics of cryptocurrency markets, offering an invaluable edge to traders navigating their often extreme volatility and 24/7 nature.
-
Navigating High Volatility: Crypto assets are renowned for rapid and significant price swings. Candlesticks provide immediate visual cues on the strength and direction of these movements within specific timeframes. A long bullish candle in Bitcoin, for example, quickly signals aggressive buying, while a shooting star at a peak could warn of an imminent reversal, allowing traders to react swiftly to fast-evolving market conditions.
-
Identifying Entry and Exit Points: Patterns like the hammer or bullish engulfing can signal optimal entry points for long positions after a downtrend. Conversely, bearish patterns like the shooting star or evening star can indicate opportune times to exit long positions or initiate short positions before a potential decline. The precision offered by candlestick patterns, especially when confirmed by other indicators, can significantly refine trade timing.
-
Understanding Market Psychology: The visual representation of OHLC prices and wick lengths inherently reflects the emotional battle between fear and greed. A long lower wick on a bullish candle, for instance, shows initial panic selling that was ultimately overcome by strong buying confidence. This insight into collective market sentiment is crucial for anticipating future price movements, particularly in emotionally driven crypto markets.
-
Risk Management: Candlestick patterns aid in strategic risk management. A clear bearish reversal pattern provides a logical point to place a stop-loss for a long position, often just above the high of the reversal candle. Similarly, bullish patterns can guide stop-loss placement for short positions. This disciplined approach helps limit potential losses.
-
Confirmation with Other Technical Indicators: While powerful, candlesticks are most effective when used in conjunction with other technical analysis tools. Combining a bullish engulfing pattern with a rising Relative Strength Index (RSI) or a bullish crossover in the Moving Average Convergence Divergence (MACD) can provide stronger confirmation of a reversal. Conversely, a bearish engulfing pattern coupled with declining volume would be a more potent signal. This multi-factor analysis reduces false signals and increases conviction.
-
Adaptability Across Timeframes: Candlestick patterns are fractal, meaning they are relevant across all timeframes. Day traders might scrutinize 1-minute or 5-minute charts for short-term opportunities, while swing traders might analyze 4-hour or daily charts for broader trend shifts. Long-term investors can use weekly or monthly charts to identify macro-level turning points.
Common Pitfalls and Mistakes in Candlestick Analysis
While incredibly powerful, candlestick charts are often misinterpreted or misused, leading to suboptimal trading decisions. Awareness of these common mistakes can significantly improve a trader’s analytical accuracy.
-
Ignoring Market Context: The most prevalent error is analyzing candlestick patterns in isolation, divorced from the broader market context. A hammer pattern, for instance, is only significant if it appears after a downtrend or near a strong support level. A shooting star in the middle of a choppy, range-bound market holds far less predictive power than one formed at the peak of an uptrend or at a resistance level. Always consider the prevailing trend, nearby support and resistance, and the overall market structure.
-
Over-Reliance on Single Patterns: No single candlestick pattern guarantees a specific outcome. Markets are complex, and even the most reliable patterns can fail. Trading every pattern seen on a chart without confirmation or context is a recipe for frequent losses. Patterns indicate probabilities, not certainties.
-
Lack of Confirmation: Failing to seek additional confirmation for a candlestick signal is a critical mistake. Confirmation can come from subsequent candles (e.g., a strong bullish candle after a hammer), volume (e.g., high volume on an engulfing candle), or other technical indicators (e.g., RSI divergence, moving average crossovers). Without confirmation, a pattern might merely be noise.
-
Ignoring Volume: Volume is the "fuel" for price movements. A strong bullish reversal pattern occurring on low volume may lack conviction and be prone to failure, whereas the same pattern with significantly increased volume indicates strong institutional or widespread participation, lending it greater credibility. Always cross-reference candlestick patterns with trading volume.
-
Inappropriate Timeframe: Applying patterns from a 5-minute chart to make decisions on a daily chart, or vice-versa, is ineffective. The significance and reliability of patterns vary with the timeframe. A Doji on a 1-minute chart is far less impactful than a Doji on a daily or weekly chart. Traders must align their analysis timeframe with their trading strategy and investment horizon.
-
Trading Against the Trend: While reversal patterns are crucial, attempting to trade every reversal, especially minor ones against a strong overarching trend, is often high-risk. Trading with the larger trend, and using continuation patterns, generally offers higher probabilities of success. Reversals are more reliable when they occur at the exhaustion point of a major trend.
-
Over-Complicating Analysis: Beginners often try to memorize too many complex patterns or integrate too many indicators simultaneously. This can lead to analysis paralysis. It is more effective to master a few reliable patterns and combine them with basic trend analysis and support/resistance, gradually adding complexity as experience grows.
Candlestick Charts vs. Other Chart Types
The choice of chart type is fundamental to a trader’s analytical approach, and each offers distinct advantages and disadvantages. Candlestick charts stand out for their visual richness and comprehensive data delivery.
| Features | Candlestick Chart | Line Chart | Bar Chart |
|---|---|---|---|
| Primary Use | Analyzing short-term to mid-term price action, market sentiment, and potential reversals. | Identifying overall long-term trends and general price direction. | Detailed price tracking, similar to candlesticks but with less intuitive pattern recognition. |
| Data Shown | Open, high, low, close (OHLC) | Closing prices only | Open, high, low, close (OHLC) |
| Pattern Recognition | Excellent for spotting reversals, continuation, and momentum shifts due to distinct visual shapes. | Poor; provides no insight into intraday price movement or market psychology. | Moderate; offers OHLC data but is generally less intuitive and visually striking for pattern recognition than candlesticks. |
| Best For | Day trading, swing trading, spotting reversals, and comprehensive trend analysis in volatile markets. | Long-term trend identification, comparing closing prices over extended periods, simplicity. | Traders who prefer raw OHLC price data without the strong visual emphasis on market sentiment that candlesticks provide. |
| Visual Clarity | High; color-coded bodies and distinct wicks make interpretation quick and intuitive, highlighting buying/selling pressure. | Weak; cannot capture intraday volatility, opening/closing dynamics, or emotional swings. Smooths out price action. | Moderate; detailed but can appear noisy and less immediately digestible than candlesticks, especially for discerning market sentiment. |
| Weakness | Can feel cluttered with too much data on very short timeframes; requires practice to interpret nuances correctly. | Lacks crucial volatility and intraday momentum information; cannot convey market psychology. | Harder to read quickly for pattern recognition; less visually intuitive for immediate market sentiment assessment. |
Conclusion
Candlestick charts are an exceptionally powerful and versatile tool for crypto traders, offering profound insights into market sentiment, momentum, and potential price reversals. By diligently studying single candles, mastering multi-candle patterns, and understanding continuation formations within the broader context of trends, support and resistance levels, and trading volume, traders can significantly enhance the accuracy and robustness of their crypto trading decisions. While no pattern can ever guarantee precise future price movements, a disciplined and comprehensive approach to candlestick analysis empowers traders to anticipate market behavior with greater confidence, manage risk more effectively, and execute more informed entries and exits. The ability to interpret these visual narratives of market psychology is a cornerstone of effective technical analysis in the fast-paced and often emotional world of cryptocurrency trading.
FAQs
What is the most reliable candlestick pattern?
There is no single candlestick pattern that guarantees success, as reliability is heavily context-dependent. However, patterns like the Hammer, Bullish and Bearish Engulfing, Morning Star, and Evening Star have historically shown high reliability when they appear at key support or resistance levels and are confirmed by increased volume or subsequent price action. A combination of factors, not just one pattern, increases predictive accuracy.
How accurate are candlestick patterns?
Candlestick patterns provide insights into market sentiment and potential price direction rather than precise predictions. Their accuracy is not absolute and depends significantly on the context, including the prevailing trend, trading volume, and the presence of other confirming technical indicators. When used in conjunction with support and resistance levels, trendlines, and a holistic market view, their reliability for identifying high-probability trading setups significantly improves, reducing the incidence of false signals.
Can beginners use candlestick charts effectively?
Yes, beginners can certainly use candlestick charts effectively by starting with a focus on fundamental patterns such as the Hammer, Shooting Star, and Bullish/Bearish Engulfing. Understanding what each candle component (open, high, low, close) represents is crucial for interpreting basic market sentiment. Practicing interpretation with historical charts and combining simple candlestick observations with trendlines and basic support/resistance levels will accelerate learning and build confidence.

What timeframe is best for candlestick trading?
The optimal timeframe for candlestick trading is highly dependent on an individual’s trading style and objectives. Day traders often utilize 1-minute, 5-minute, or 15-minute charts to capture short-term price fluctuations. Swing traders typically prefer 4-hour or daily charts to identify and capitalize on broader, multi-day trends. Long-term investors may monitor daily or weekly charts to identify significant market turning points or confirm macro trends. It is essential to align the chosen timeframe with one’s trading strategy and risk tolerance.
Which chart is best for day trading?
Candlestick charts are overwhelmingly the most popular and effective choice for crypto day trading strategies. They provide a wealth of detailed information about price action, clearly highlight critical patterns, and make it significantly easier to spot rapid reversals and shifts in momentum within short timeframes. While bar charts offer similar data, their visual representation is generally less intuitive for quick pattern recognition, and line charts completely lack the intraday detail essential for active trading.
What does a Doji candle indicate?
A Doji candle forms when the open and close prices are nearly identical, resulting in a very small or virtually absent real body. This indicates a state of indecision or equilibrium in the market, suggesting that buying and selling pressures were balanced within that specific period. A Doji appearing at a critical support or resistance level can be a significant signal of a potential trend reversal, as it suggests the previous trend’s momentum is waning. However, confirmation from subsequent candles or additional indicators is paramount before taking any trading