
Ethereum, the second most valuable cryptocurrency by market capitalization after Bitcoin, continues to command significant attention from investors and developers alike. Its foundational role in powering decentralized applications (dApps), smart contracts, and the burgeoning Web3 economy makes understanding its market dynamics crucial for anyone considering investment. This comprehensive analysis delves into Ethereum’s market snapshot, historical performance, and technical indicators, providing a detailed outlook and price predictions for the period spanning 2026 through 2030. We will explore the underlying factors influencing ETH’s value, including network adoption, technological advancements, macroeconomic trends, and competitive pressures, to offer a professional journalistic perspective on its long-term growth potential.
Ethereum (ETH) Overview: The Foundation of Decentralization
Launched in 2015 by Vitalik Buterin, Ethereum revolutionized the blockchain landscape by introducing programmable smart contracts, moving beyond Bitcoin’s primary function as a peer-to-peer digital cash system. This innovation enabled developers to build and deploy a vast array of decentralized applications, from complex financial protocols to digital asset marketplaces and non-fungible tokens (NFTs). ETH, the native cryptocurrency of the Ethereum network, serves as the essential "gas" fee for transactions, rewarding network participants and securing the ecosystem.
A pivotal moment in Ethereum’s history was its transition from a Proof-of-Work (PoW) to a Proof-of-Stake (PoS) consensus mechanism in September 2022, known as "The Merge." This monumental upgrade significantly reduced Ethereum’s energy consumption by an estimated 99.95%, addressing environmental concerns and enhancing its sustainability. Beyond environmental benefits, The Merge laid critical groundwork for future scalability improvements, cementing Ethereum’s commitment to long-term viability and efficiency within the blockchain space. Subsequent upgrades, such as Shanghai in April 2023, enabled the withdrawal of staked ETH, further refining the PoS model and increasing validator participation.
Current Market Snapshot: Navigating Early 2026 Dynamics
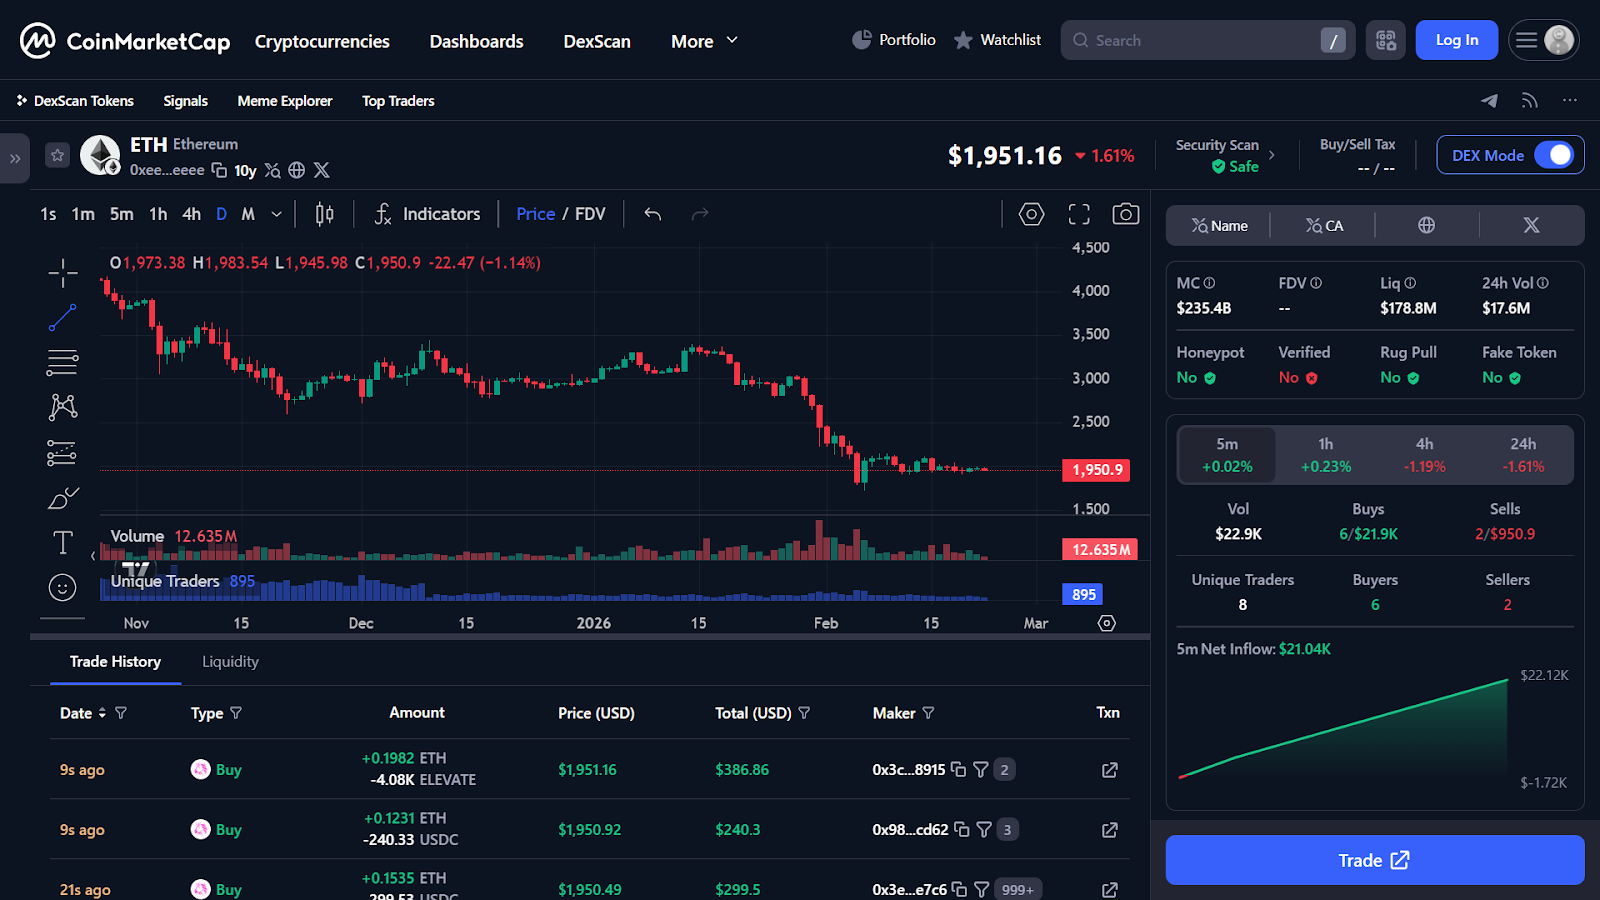
As of early 2026, Ethereum’s native token, Ether (ETH), is trading within a range of $1,900 to $3,000, reflecting a period of consolidation amidst broader market volatility. Its market capitalization remains robust, comfortably exceeding $235.25 billion, underscoring its position as a dominant force in the digital asset landscape. Live market dashboards across major exchanges continually track ETH’s price movements against the USD, revealing fluctuating trading volumes and shifting investor sentiment.
Beyond its price ticker, Ethereum represents a global decentralized blockchain infrastructure that underpins a vast segment of the crypto economy. It acts as the digital fuel for a myriad of activities, spanning decentralized finance (DeFi), the burgeoning non-fungible token (NFT) market, and the foundational layers of Web3. While Bitcoin often dictates overall market sentiment and macro price trends, Ethereum’s price dynamics are uniquely intertwined with its network utility and adoption metrics. Growth in on-chain transaction activity, the expansion of its Layer-2 scaling solutions, and the ongoing development of its ecosystem directly influence ETH’s fundamental value proposition. Consequently, a holistic understanding of Ethereum’s technological advancements and its utility within the decentralized ecosystem is paramount, extending beyond mere price chart analysis.
ETH Price History and Performance: A Journey of Volatility and Innovation
Since its launch in 2015, Ethereum has embarked on a remarkable journey marked by periods of explosive growth and significant corrections. Early investors witnessed substantial returns as the network gained traction, culminating in its initial major price surges. The all-time high of $4,946, achieved in August 2025 (as per the provided timeline), illustrates the immense potential and investor confidence that Ethereum has historically commanded. This peak was largely propelled by the exponential growth of decentralized finance (DeFi) protocols and the increasing adoption of tokenized assets, all built predominantly on the Ethereum blockchain.
Ethereum’s strategic roadmap has been a critical determinant of its performance. The successful transition to Proof-of-Stake in 2022 was a monumental engineering feat, significantly enhancing the network’s scalability and energy efficiency, which positively influenced long-term investor sentiment. Looking ahead, upcoming upgrades, such as the Dencun (Cancun-Deneb) update, are poised to further improve network efficiency by introducing "proto-danksharding" (EIP-4844). This innovation aims to drastically reduce transaction costs for Layer-2 scaling solutions, thereby increasing throughput and enhancing interoperability across the Ethereum ecosystem. Such continuous development efforts are expected to fortify Ethereum’s standing as the premier blockchain for DeFi, smart contracts, and Web3 innovation.
Ethereum (ETH) Technical Analysis: Dissecting Market Signals
Ethereum’s current trading range between $1,900 and $3,000 provides a fertile ground for technical analysis, offering insights into prevailing market sentiment and potential future movements. Key technical indicators, including moving averages and the Relative Strength Index (RSI), are indispensable tools for discerning price trends.
Moving Averages
Currently, ETH is trading below its 50-day Exponential Moving Average (EMA) at approximately $2,100 and its 200-day EMA at $2,300. This configuration typically signals a bearish trend, indicating sustained selling pressure where shorter-term price action is declining faster than the longer-term average. The EMAs, which give more weight to recent prices, reflect the market’s immediate downward momentum. A crucial bullish reversal signal, often referred to as a "Golden Cross," would occur if the 50-day EMA were to cross above the 200-day EMA. Conversely, a "Death Cross" (50-day EMA crossing below 200-day EMA) is a strong bearish indicator. Investors are keenly watching for any signs of these crossovers as they often precede significant shifts in market direction. For ETH to invalidate the current bearish sentiment, it would need to decisively break above both EMAs, ideally on increasing volume, signaling renewed buying interest.
Relative Strength Index (RSI)
Ethereum’s Relative Strength Index (RSI) is hovering around 48, suggesting neutral momentum. The RSI is a momentum oscillator that measures the speed and change of price movements, ranging from 0 to 100. An RSI reading below 30 typically indicates oversold conditions, hinting at a potential bounce or reversal as selling pressure exhausts. Conversely, a reading above 70 suggests overbought conditions, often preceding a price correction or consolidation as buyers become fatigued. A neutral RSI like 48 implies that neither buyers nor sellers are currently dominating the market, suggesting a period of indecision or sideways movement within the established price range. Sustained movement towards either extreme would signal a shift in momentum that traders would monitor closely.
Key Price Levels: Support and Resistance
Understanding key support and resistance levels is fundamental for traders and investors. Support levels are price points where a downtrend is expected to pause due to a concentration of buying interest, preventing further declines. Resistance levels are price points where an uptrend is expected to pause due to a concentration of selling interest, hindering further price increases.
Support Levels:
- S1: $1,900 – A critical psychological and technical support level.
- S2: $1,800 – If S1 breaks, this level would be the next line of defense.
- S3: $1,700 – A stronger support zone, potentially indicating a deeper correction.
- S4: $1,600 – Historical confluence point, if reached, would signal significant bearish pressure.
- S5: $1,500 – A major long-term support, breaking this would be a strong bearish signal.
Resistance Levels:
- R1: $2,300 – Coincides with the 200-day EMA, a significant hurdle.
- R2: $2,500 – A psychological resistance level, breaking which could signal bullish momentum.
- R3: $2,700 – A more formidable resistance, requires strong buying volume to overcome.
- R4: $2,900 – Approaching the upper bound of the current trading range.
- R5: $3,000 – The current ceiling of the established range, a decisive break could usher in a new uptrend.
ETH Price Prediction 2027: A Year of Potential Growth
Analyst models project a steady upward trajectory for Ethereum through 2027, driven by continued network development and broader market recovery. The Dencun upgrade’s impact on Layer-2 scalability is expected to foster increased adoption and transaction volume, making the Ethereum ecosystem more attractive for users and developers. Institutional interest, coupled with potential regulatory clarity, could also contribute to sustained capital inflows.
| Month | Minimum Price (USD) | Average Price (USD) | Maximum Price (USD) | Expected ROI (%) |
|---|---|---|---|---|
| January | $2,400 | $3,150 | $3,900 | +95% |
| February | $2,410 | $3,160 | $3,910 | +96% |
| March | $2,420 | $3,170 | $3,920 | +97% |
| April | $2,430 | $3,180 | $3,930 | +98% |
| May | $2,440 | $3,190 | $3,940 | +99% |
| June | $2,450 | $3,200 | $3,950 | +100% |
| July | $2,460 | $3,210 | $3,960 | +101% |
| August | $2,470 | $3,220 | $3,970 | +102% |
| September | $2,480 | $3,230 | $3,980 | +103% |
| October | $2,490 | $3,240 | $3,990 | +104% |
| November | $2,500 | $3,250 | $4,000 | +105% |
| December | $2,510 | $3,260 | $4,010 | +106% |
These predictions reflect a conservative growth model, factoring in the inherent volatility of the crypto market but also acknowledging Ethereum’s fundamental strengths and ongoing development. The projected ROI indicates that investors entering at current levels could see significant appreciation over the year.

ETH Price Prediction 2028: Sustained Momentum
Building on the foundation established in 2027, 2028 is anticipated to be another year of upward momentum for Ethereum. The network’s continued dominance in DeFi and NFTs, coupled with potential advancements in sharding or other scalability solutions, could further solidify its market position. Global economic conditions and the wider acceptance of digital assets are also expected to play a crucial role.
| Month | Minimum Price (USD) | Average Price (USD) | Maximum Price (USD) | Expected ROI (%) |
|---|---|---|---|---|
| January | $2,500 | $3,300 | $4,100 | +110% |
| February | $2,510 | $3,310 | $4,110 | +111% |
| March | $2,520 | $3,320 | $4,120 | +112% |
| April | $2,530 | $3,330 | $4,130 | +113% |
| May | $2,540 | $3,340 | $4,140 | +114% |
| June | $2,550 | $3,350 | $4,150 | +115% |
| July | $2,560 | $3,360 | $4,160 | +116% |
| August | $2,570 | $3,370 | $4,170 | +117% |
| September | $2,580 | $3,380 | $4,180 | +118% |
| October | $2,590 | $3,390 | $4,190 | +119% |
| November | $2,600 | $3,400 | $4,200 | +120% |
| December | $2,610 | $3,410 | $4,210 | +121% |
These figures suggest a continuation of the growth trend, albeit with potentially higher average prices and a more optimistic outlook on maximum values, indicating increasing confidence in Ethereum’s long-term utility and adoption.
Long-term Outlook: ETH Price Prediction (2026–2030)
The long-term forecast for Ethereum is predicated on its enduring utility, continuous technological evolution, and its ability to maintain a leading position in the decentralized economy. Projections for 2026-2030 indicate a steady appreciation in value, reflecting increasing global adoption and the maturation of the crypto market.
| Year | Minimum Price (USD) | Average Price (USD) | Maximum Price (USD) | Expected ROI (%) |
|---|---|---|---|---|
| 2026 | $1,900 | $3,100 | $3,900 | +95% |
| 2027 | $2,400 | $3,250 | $4,000 | +105% |
| 2028 | $2,500 | $3,400 | $4,200 | +120% |
| 2029 | $2,600 | $3,550 | $4,400 | +135% |
| 2030 | $2,700 | $3,700 | $4,600 | +150% |
This long-term outlook suggests a compounded growth, with potential returns of up to 150% by 2030, based on current market valuations. These projections are grounded in the expectation of successful implementation of Ethereum’s roadmap, continued expansion of its ecosystem, and favorable macroeconomic conditions that encourage investment in digital assets.
What Factors Influence Ethereum’s Price?
Investing in Ethereum in 2026 and beyond necessitates a deep understanding of the multifaceted factors that drive its value. ETH’s price movements are not solely influenced by speculative headlines but are deeply rooted in network activity, capital flows, competitive dynamics, and broader economic conditions.
1. Network Adoption and Real Utility:
The Ethereum network is the backbone for thousands of decentralized applications, sophisticated financial protocols, and digital asset platforms. Every interaction on this network, from executing a smart contract to transferring an NFT, requires ETH to cover transaction fees (gas). This inherent utility creates a continuous, organic demand for ETH, distinguishing it from purely speculative assets. As DeFi protocols grow, as more enterprises adopt blockchain solutions, and as Web3 expands, the demand for ETH as the underlying computational fuel naturally increases. The Total Value Locked (TVL) in Ethereum-based DeFi protocols, often exceeding tens of billions of dollars, serves as a strong indicator of this utility.
2. Competition from Other Blockchains:
While Ethereum pioneered the smart contract space, it faces robust competition from a new generation of blockchains, often referred to as "Ethereum killers." Networks like Solana, Avalanche, BNB Chain, and Cardano prioritize attributes such as lower transaction fees, higher transaction speeds, and alternative consensus mechanisms. While Ethereum maintains a significant lead in decentralization and security, a developer migration to alternative chains offering perceived cost efficiencies or faster finality could impact Ethereum’s short-term growth trajectory. However, Ethereum’s robust developer community, established network effects, and ongoing scalability improvements via Layer-2 solutions aim to mitigate these competitive pressures.
3. Supply Dynamics: Staking and Scarcity:
Ethereum’s transition to Proof-of-Stake fundamentally reshaped its supply model. Validators are required to lock up (stake) significant amounts of ETH to secure the network and earn rewards. This process effectively removes a substantial portion of ETH from active trading circulation, creating scarcity. Furthermore, the implementation of EIP-1559 in August 2021 introduced a mechanism where a portion of transaction fees is permanently "burned," meaning it is removed from the total supply. During periods of high network activity, this burning mechanism can lead to a net deflationary pressure on ETH’s supply, potentially driving up its value over time. Millions of ETH are currently staked, significantly reducing the available liquid supply.
4. Market Cycles and Investor Sentiment:
Cryptocurrency markets are notoriously cyclical, often influenced by Bitcoin’s overarching price movements. Ethereum, as the largest altcoin, typically follows Bitcoin’s general direction but often exhibits higher volatility during both bull runs and bear markets. In strong bull markets, ETH frequently benefits from "altcoin season," where capital rotates from Bitcoin into major alternative assets. Conversely, during downturns, ETH tends to retrace alongside the broader market, sometimes with amplified losses. Macroeconomic factors, such as inflation rates, interest rate hikes, and global liquidity conditions, also significantly influence overall investor sentiment and risk appetite, impacting crypto markets.
5. Gaming, Web3 Expansion, and Institutional Capital:
Ethereum has been instrumental in establishing early blockchain gaming and digital asset ecosystems. While some projects have migrated to or started on alternative networks due to scalability concerns, Ethereum continues to influence core Web3 infrastructure and high-value decentralized applications. The increasing adoption of blockchain technology across various sectors, including gaming, metaverse development, tokenized real-world assets, and enterprise solutions, expands network activity and strengthens demand for ETH. Moreover, the growing interest from institutional investors, including hedge funds, asset managers, and corporations, signals a maturing market and provides substantial capital inflows, further bolstering Ethereum’s long-term prospects.
Key Risks That Could Impact ETH’s Forecast
While Ethereum possesses strong fundamentals and a clear development roadmap, any price prediction must account for inherent risks within the volatile cryptocurrency market.
- Regulatory Uncertainty: The global regulatory landscape for cryptocurrencies remains fragmented and evolving. Potential for restrictive regulations, particularly in major economic blocs, could impact the operation of decentralized applications, stablecoins, or even the classification of ETH itself, potentially dampening investor sentiment and hindering adoption.
- Scalability Challenges: Despite the transition to PoS and the development of Layer-2 solutions, Ethereum still faces challenges in achieving mass scalability to support billions of users. Delays in crucial upgrades like sharding, or unforeseen technical hurdles, could lead to network congestion and high gas fees, pushing users and developers towards competitor chains.
- Security Vulnerabilities: As a complex software system, Ethereum is not immune to security risks. Smart contract bugs, protocol-level vulnerabilities, or attacks on the network’s infrastructure could lead to significant financial losses and erode user trust.
- Intensified Competition: The blockchain space is highly competitive. New "Ethereum killers" continually emerge, promising superior performance or innovative features. While Ethereum has a significant first-mover advantage and network effect, a truly disruptive competitor could challenge its dominance.
- Macroeconomic Headwinds: A severe global economic downturn, persistent high inflation, or a significant financial crisis could reduce investor appetite for risk assets like cryptocurrencies, leading to widespread sell-offs regardless of Ethereum’s individual fundamentals.
- Centralization Concerns: While PoS aims for decentralization, concerns about potential validator centralization or the influence of large staking pools persist. Any perceived centralization could undermine the network’s core ethos and affect its long-term appeal.
Final Thoughts
Ethereum stands as one of the most pivotal and influential assets in the entire cryptocurrency market. The Ethereum network’s unparalleled ability to power decentralized finance, facilitate digital asset creation, and drive Web3 innovation provides ETH with a tangible utility that extends far beyond mere speculation. Its continuous evolution through strategic upgrades, combined with a robust developer ecosystem and growing institutional interest, positions it for sustained relevance.
Long-term forecasts for ETH are inherently tied to a confluence of factors: the pace of global adoption of decentralized technologies, the dynamics of its supply model, the intensity of competition, the clarity of regulatory frameworks, and the overarching cycles of the crypto market. Before making any investment decisions in Ethereum for 2026 or considering a long-term hold, prospective investors are strongly advised to prioritize thorough fundamental research over speculative hype. A diligent approach, grounded in realistic expectations and comprehensive due diligence, will always be more valuable than chasing short-term price swings in navigating the complex and dynamic world of digital assets.
FAQs
Will Ethereum reach $10,000 by 2030?
Ethereum could potentially reach $10,000 by 2030 if it maintains its dominance in DeFi, successfully implements its full scalability roadmap, and benefits from widespread institutional adoption and a favorable macroeconomic environment. However, this is a speculative forecast and depends on numerous variables, making it not guaranteed.
Is Ethereum a good long-term investment?
Ethereum is widely considered a promising long-term investment due to its foundational role in DeFi and smart contracts, its continuous technological upgrades (such as the transition to PoS and upcoming scalability solutions), and its vast, active developer community. Its utility as the backbone of Web3 underpins its long-term value proposition.
What will Ethereum be worth in 2026?
Based on current market trends and its blockchain roadmap, Ethereum is projected to trade within a range of $1,900 to $3,900 in 2026. These figures account for expected market volatility but also anticipate growth driven by network enhancements and increasing adoption.
Is Ethereum staking profitable?
Yes, Ethereum staking can be profitable, offering rewards to participants who lock up their ETH to secure the network. The profitability depends on factors such as the amount of ETH staked, the overall network activity (which influences transaction fees and thus burned ETH), and the current staking yield, which fluctuates based on the total amount of ETH staked.
Does Ethereum follow Bitcoin’s market cycle?
Yes, Ethereum often exhibits a strong correlation with Bitcoin’s market cycle, typically following Bitcoin’s broader price movements as the leading cryptocurrency. However, Ethereum also possesses unique drivers, such as developments in its DeFi ecosystem, NFT market trends, and its staking mechanism, which can cause its price dynamics to diverge at times.