
Bitcoin (BTC) is exhibiting strong signals for a potential price recovery in the coming weeks, driven by a notable shift in sentiment among institutional speculators in the CME futures market and a confluence of supportive technical indicators. This optimistic outlook echoes past market bottoms that preceded significant rallies, though analysts caution that considerable risks remain, including the possibility of further price declines before a sustained uptrend solidifies.
The latest data from the Commodity Futures Trading Commission (CFTC) Commitment of Traders (COT) report, released last week, reveals a pivotal shift in positioning among non-commercial Bitcoin futures traders. These large speculators, typically comprising hedge funds and other significant financial institutions often referred to as "smart money," have dramatically reduced their net short positions. Their net position has moved from approximately +1,000 contracts a month prior to about -1,600 contracts, effectively transitioning from a net short to a net long stance on the CME. This means that for the first time in a significant period, bulls now outnumber bears among these influential market participants.
The Shifting Tides of "Smart Money" in CME Futures
The rapid unwinding of net short positions by non-commercial traders is a development closely watched by market analysts. Historically, such shifts have often preceded significant price movements in Bitcoin. Analyst Tom McClellan noted that this rapid net-short unwind implies that "smart money" has added long positions "with some urgency." McClellan highlighted two similar past instances where such a positioning shift in CME Bitcoin futures presaged a major price bottom and subsequent recovery.

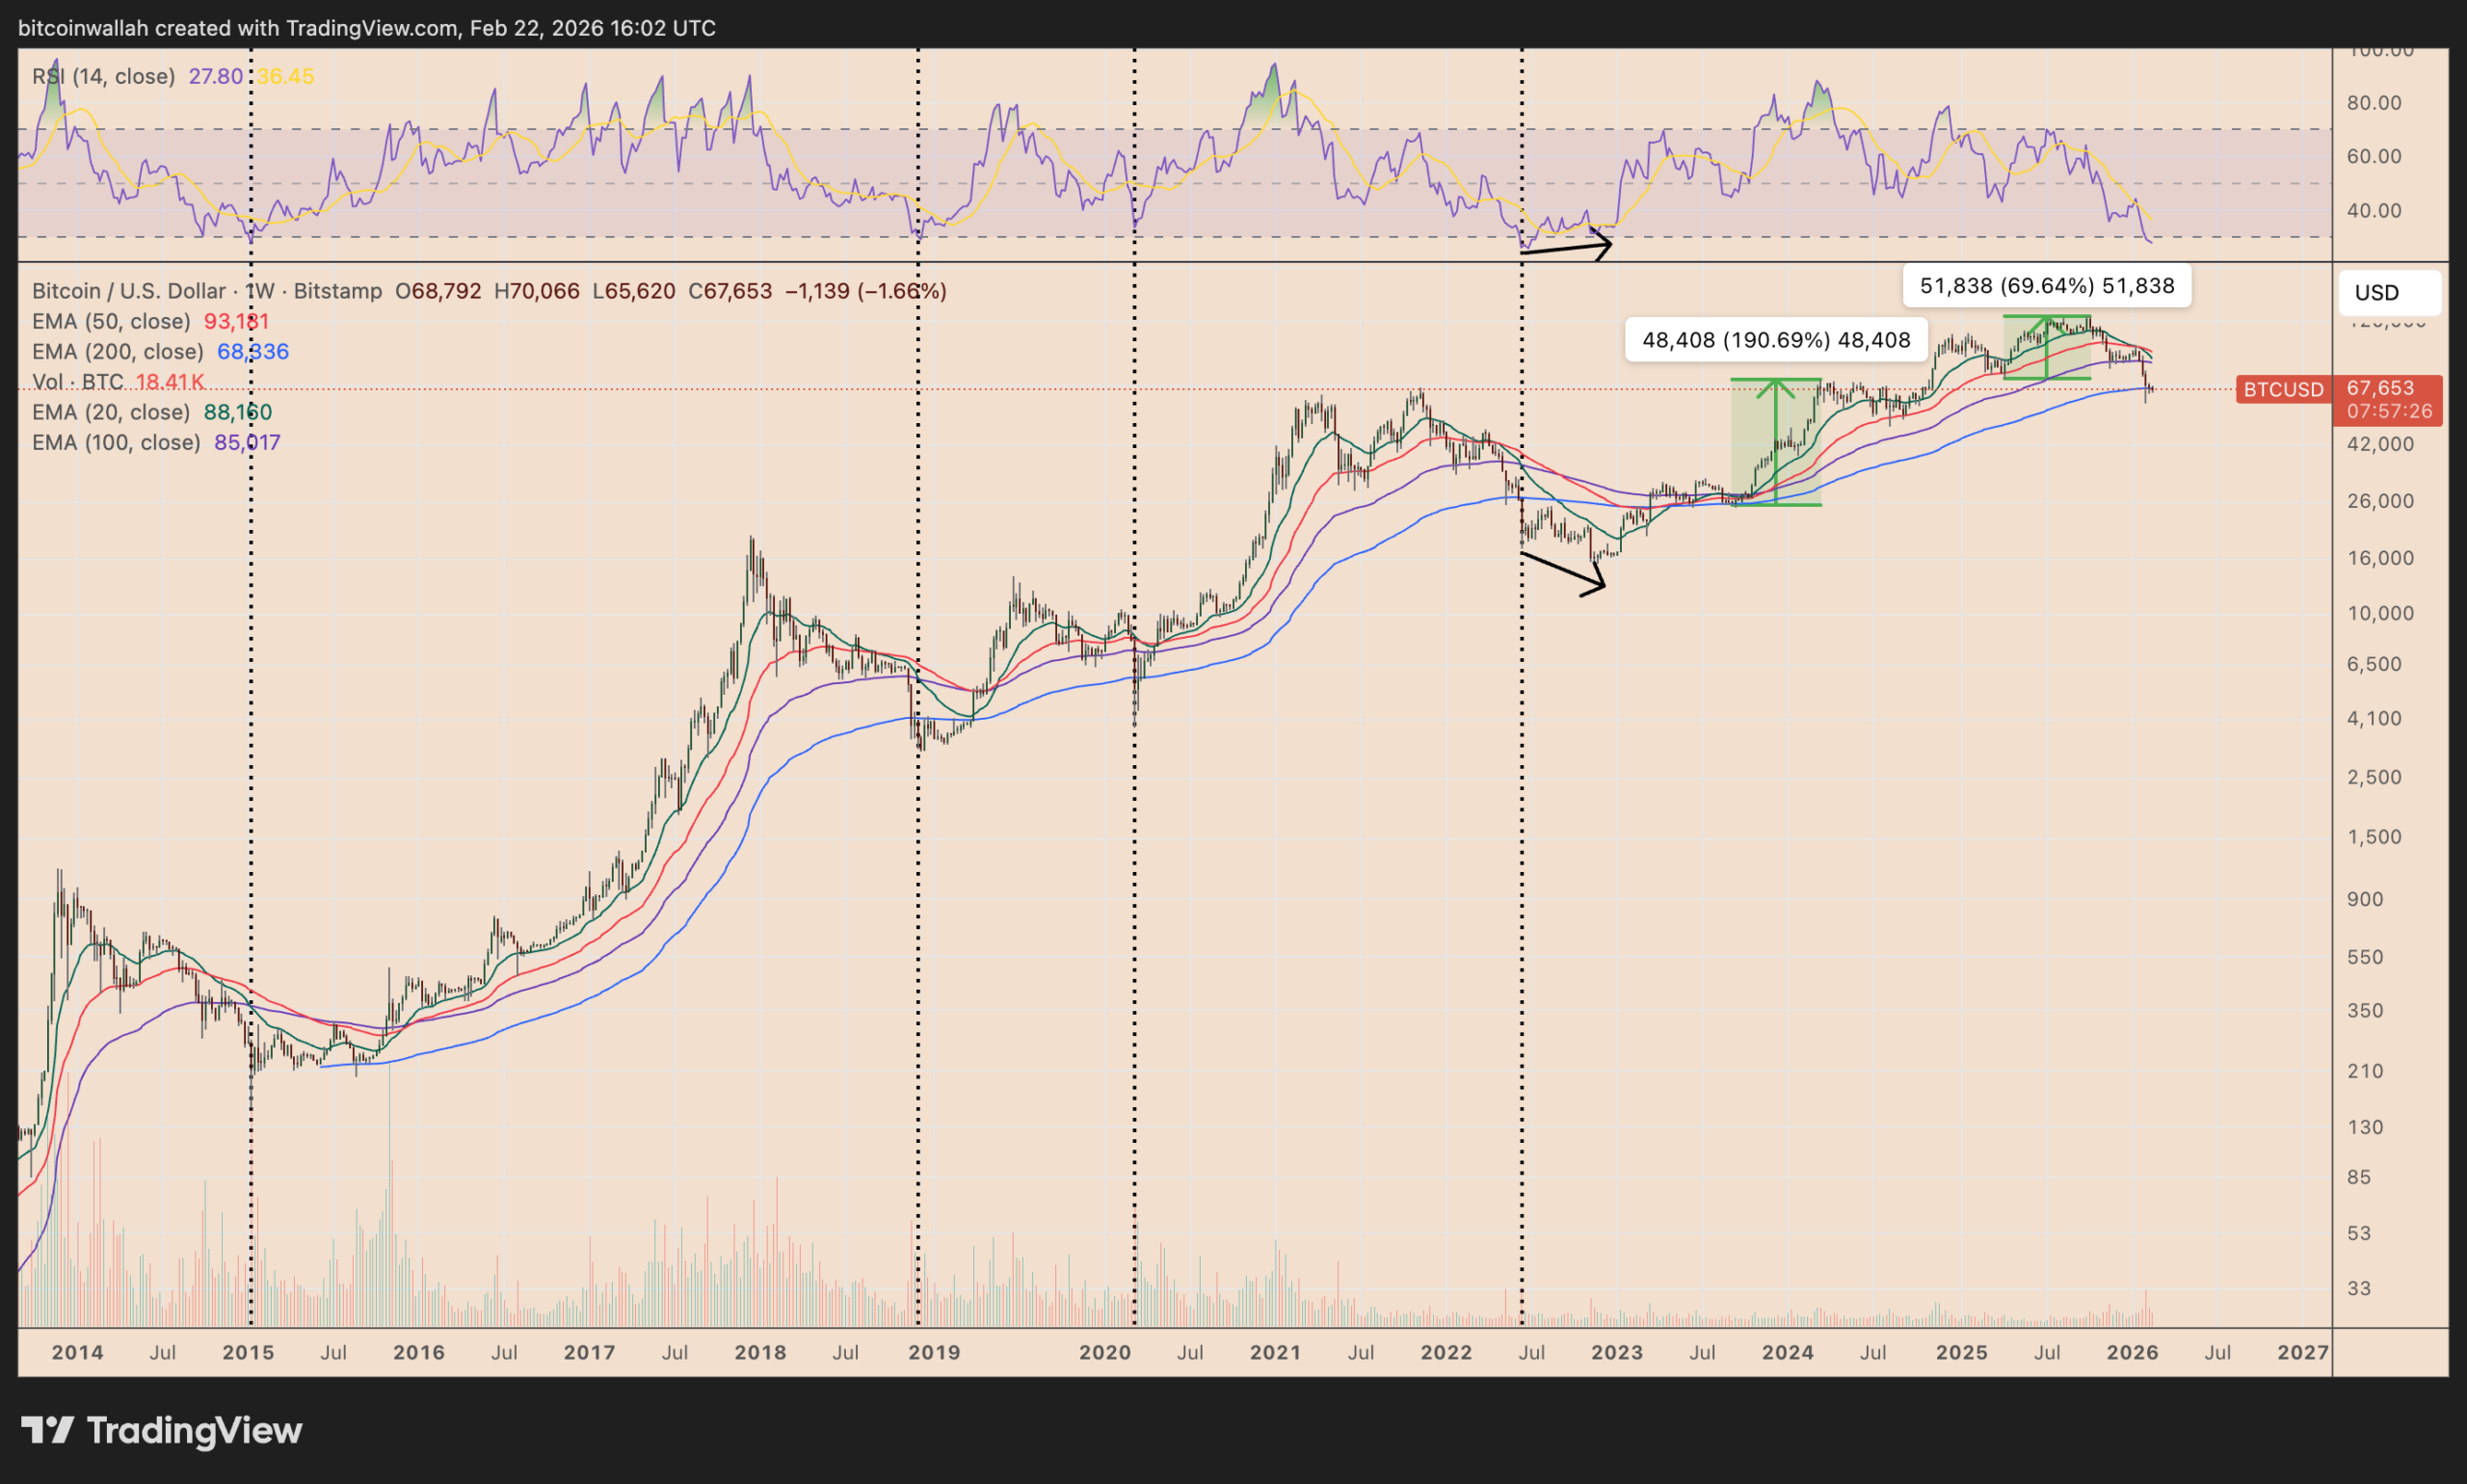
One prominent example occurred in April 2025. Following a sharp dip in CME Bitcoin futures net shorts, similar to the current pattern, BTC’s price embarked on a substantial rally, gaining approximately 70%. An even more dramatic recovery was observed in 2023, when Bitcoin’s price surged by over 190% under comparable futures market conditions. These historical precedents lend considerable weight to the current market dynamic, suggesting that institutional players are increasingly betting on an upward trajectory for Bitcoin. The "smart money" thesis posits that these large, well-resourced entities often possess superior market insights or act on information ahead of retail investors, making their collective positioning a powerful indicator. Their move from a cautious, net-short stance to an aggressive, net-long accumulation suggests a belief that Bitcoin’s current price levels represent an attractive entry point.
Technical Confluence: A Multi-Indicator Analysis
Beyond the futures market, Bitcoin’s price action on the spot market is reinforcing the bullish narrative through several key technical indicators. As of February, Bitcoin is notably defending its 200-week Exponential Moving Average (EMA). This particular moving average, currently hovering around $68,350, has historically served as a critical bear-market floor during most major drawdowns over the past decade.
-
The 200-week EMA as a Historical Support: The 200-week EMA is a long-term indicator that smooths out price data over 200 weeks, providing a clear trend line. When Bitcoin’s price drops to and finds support at this moving average, it has often marked the end of a downtrend and the initiation of a new recovery phase. This phenomenon was observed in 2015, 2018, and 2020, each instance preceding substantial bull runs. Its current defense suggests that strong buying interest is emerging at these crucial levels, preventing further downside. For many long-term investors and technical analysts, the 200-week EMA represents a fundamental value zone, and a bounce from it is considered a very strong bullish signal.
-
Oversold Conditions (RSI): Adding to the technical confluence, Bitcoin’s weekly Relative Strength Index (RSI) remains deep in oversold territory. The RSI is a momentum oscillator that measures the speed and change of price movements. An RSI reading below 30 typically indicates that an asset is oversold, suggesting that selling pressure may be nearing exhaustion and a bounce or reversal could be imminent. The combination of price holding at a historically significant support level (200-week EMA) and an oversold RSI often signals a high probability of a relief rally or a more sustained recovery.

-
Potential Price Target: $85,000: Should Bitcoin decisively rebound from its 200-week EMA and build upward momentum, analysts are eyeing the 100-week EMA (represented by the purple wave on charts) as the next significant resistance level. This indicator is currently positioned at approximately $85,000. A successful push towards and potentially beyond this level by April would solidify the recovery narrative and could attract further institutional and retail capital, fueling a more extended rally. The journey from current levels to $85,000 represents a significant percentage gain, offering substantial upside for early movers.
Historical Precedents and Cyclical Patterns
Bitcoin’s market behavior has often been characterized by distinct cycles, and the current scenario invites comparisons to previous periods of accumulation and subsequent growth. The 2023 recovery, which saw BTC’s price rise by over 190%, and the 70% gain after the April 2025 dip, were not isolated incidents but rather illustrations of how market sentiment, particularly among large participants, can trigger substantial price movements when combined with favorable technical setups. These cycles are often influenced by a complex interplay of investor psychology, macroeconomic factors, and intrinsic network developments, though the "smart money" positioning often serves as a leading indicator for shifts in sentiment.
While not explicitly tied to the futures market, some analysts, including those from Kaiko, have also referenced Bitcoin’s "four-year cycle" framework. This framework suggests that Bitcoin’s price movements often follow predictable patterns over roughly four-year periods, often culminating in significant bottoms and subsequent rallies. Based on this historical model, some predictions have placed a potential bottom for BTC in the $40,000–$50,000 range. This cyclical perspective, even if suggesting a lower potential bottom, still implies that the current downturn is part of a larger, recurring pattern that ultimately leads to recovery. Understanding these cyclical tendencies provides a broader context for the current market dynamics, suggesting that even amidst volatility, there are underlying patterns that could guide future price action.
Navigating the Risks: A Cautious Outlook

Despite the compelling bullish indicators, market participants are urged to exercise caution. Analyst Tom McClellan himself emphasized that the observed "smart money" shift is "a condition, not a signal." This distinction is crucial: while the conditions are ripe for a recovery, it does not guarantee an immediate or uninterrupted upward trajectory. Bitcoin could still experience further price slides from its current levels before a durable low is definitively established.
A stark reminder of this inherent volatility comes from the 2022 market scenario. In that instance, despite similar oversold conditions and Bitcoin initially trading around its 200-week EMA, the cryptocurrency ultimately plunged by over 40% after breaking below this critical support level. A repeat of such a 40% plunge in 2026 from current levels would see BTC prices fall significantly. Furthermore, considering Bitcoin’s record high of approximately $126,270, a 60% decline from that peak would also place the price around $50,500, aligning with the lower end of some cyclical predictions. If the 2022 scenario were to fully repeat, a 40% drop from current levels near $68,350 would push Bitcoin down towards the $41,000 mark. This potential downside is a critical consideration for investors, highlighting that the market remains susceptible to significant corrections, even when underlying indicators appear favorable.
The possibility of Bitcoin bottoming around $40,000–$50,000, as suggested by some analysts relying on the "four-year cycle" framework, reinforces the need for a balanced perspective. While the current futures positioning and technical support are encouraging, the historical precedent of significant downside even from established support levels means that traders and investors must remain vigilant. Macroeconomic headwinds, unexpected regulatory shifts, or broader market contagion could all serve as catalysts for further declines, overriding otherwise bullish technical signals.
Expert Commentary and Market Sentiment
The prevailing sentiment among many market observers is one of cautious optimism. The shift in non-commercial traders’ positions on the CME is seen as a strong vote of confidence from sophisticated investors, who typically have a longer-term view and more robust research capabilities. Their "urgent" accumulation of long positions, as noted by McClellan, suggests conviction in Bitcoin’s intrinsic value and future potential, even amidst current market uncertainties.

However, this optimism is tempered by the recognition of Bitcoin’s inherent volatility and its history of sharp drawdowns. The debate continues regarding whether the current defense of the 200-week EMA will prove as resilient as in past cycles, or if the market is poised for a retest of lower support levels, akin to the 2022 downturn. The consensus leans towards a belief that the long-term trend remains positive, but the path to recovery may not be linear. Analysts will be closely watching for confirmation of a durable bottom, which would likely involve sustained price action above key moving averages and a continued influx of buying volume.
Conclusion and Outlook
The current state of the Bitcoin market presents a compelling dichotomy: strong underlying bullish signals from institutional futures positioning and a confluence of supportive technical indicators suggesting an imminent recovery, juxtaposed with significant historical precedents of sharp downturns. The "smart money" is turning net bullish on CME futures, mirroring patterns that preceded substantial Bitcoin rallies in 2023 and 2025. Simultaneously, Bitcoin’s price is defending its historically significant 200-week EMA, while its weekly RSI signals oversold conditions, collectively pointing towards a potential target of $85,000 by April.
However, the cautionary tale of 2022, where Bitcoin plunged despite similar bullish setups, serves as a vital reminder that market conditions are complex and can shift rapidly. The possibility of a further decline toward the $40,000-$50,000 range, as suggested by cyclical models, cannot be discounted. Investors and traders are therefore navigating a period of both significant opportunity and considerable risk. The coming weeks will be critical in determining whether the current shift in "smart money" sentiment and the strength of key technical supports will indeed pave the way for a robust recovery, or if Bitcoin is destined for another test of lower price levels before a sustained bull market can truly take hold. Vigilance, thorough research, and a clear understanding of risk management remain paramount in this dynamic market environment.
This article does not contain investment advice or recommendations. Every investment and trading move involves risk, and readers should conduct their own research when making a decision. While we strive to provide accurate and timely information, Cointelegraph does not guarantee the accuracy, completeness, or reliability of any information in this article. This article may contain forward-looking statements that are subject to risks and uncertainties. Cointelegraph will not be liable for any loss or damage arising from your reliance on this information.